
Kazakhstan is a country with a rich and diverse ethnic composition, shaped by its history, geography, and social changes over time. In this article, I explore three key aspects of Kazakhstan's ethnic composition: the percentage of Kazakhs by region, the ethnic majority in various districts, and the historical changes in the national composition over time. These visualizations were created using both R and Python programming languages with various libraries and datasets.
Percentage of Kazakhs by Region
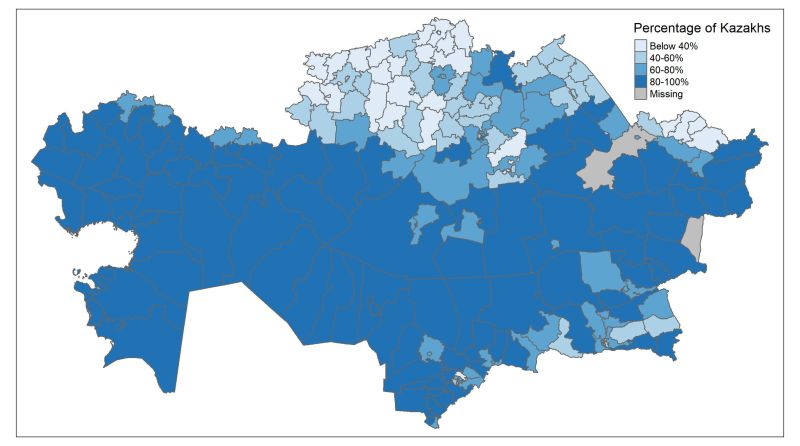
The first visualization focuses on the percentage of Kazakhs across different regions of Kazakhstan. This map was created using R and the following libraries: devtools, geokz, dplyr, sf, and tmap. The data reveals significant variations in the concentration of Kazakhs across the country:
1. Southern Kazakhstan: High concentration of Kazakhs (80-100%).
2. Northern and Eastern regions: Low concentration of Kazakhs (below 40%).
3. Central regions: Diversity in Kazakh population percentages (40-80%).
4. Western regions: High concentration of Kazakhs, especially in Mangystau and Atyrau regions.
5. Historical influence: Northern regions with lower Kazakh concentrations may reflect the impact of Soviet industrialization and resettlement policies.
The highest concentration is in the Aksuat district (Abai), where Kazakhs make up 99.5% of the population. The lowest concentration is in the Fyodorovka district (Kostanay), where Kazakhs make up 21% of the population.
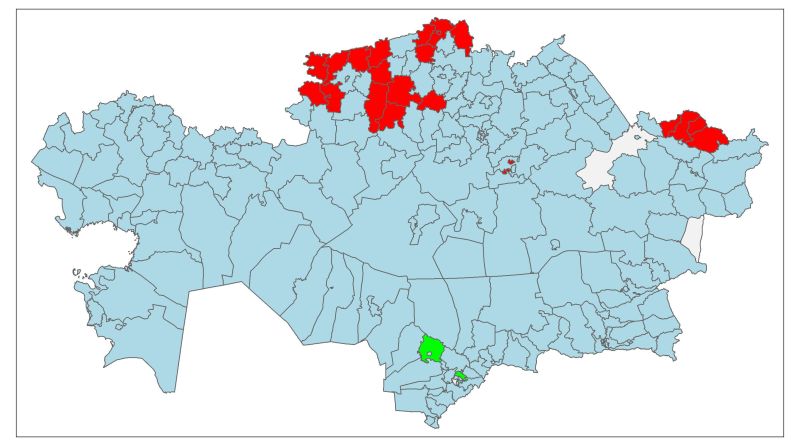
Figure 1: Percentage of Kazakhs in the regions of Kazakhstan
Ethnic Majority by District
The second map focuses on the ethnic majority in various districts of Kazakhstan. This visualization was also created using R, with the following libraries: devtools, geokz, dplyr, sf, and tmap. The map uses different colors to represent the majority ethnic group in each district:
- 💙 Blue: Kazakhs
- ❤️ Red: Russians
- 💚 Green: Uzbeks
- 🦕 Gray: New district (no data available)
The top three districts where Russians are the majority are:
1. Ridder City (East Kazakhstan): 73% of the population
2. Shemonaikha District (East Kazakhstan): 70% of the population
3. Altai District (East Kazakhstan): 68% of the population
Uzbeks are the majority in two districts of Turkistan region:
1. Sairam District: 66% of the population
2. Sauran District: 57% of the population
Historical Changes in Ethnic Composition
The third analysis visualizes the historical changes in Kazakhstan's ethnic composition over more than a century. This visualization was created using Python, utilizing libraries such as Matplotlib, NumPy, and Pandas. The data is derived from national censuses conducted in 1897, 1926, 1939, 1959, 1970, 1979, 1989, 1999, 2009, and 2021.
Key findings from the analysis include:
Kazakhs: The Kazakh population has experienced significant fluctuations due to historical events such as famine, World War II, and post-Soviet emigration. From a peak of 3.4 million in 1897, the population dropped significantly due to famine in the 1920s and 1930s, reaching 2.1 million in 1939. The population has since recovered, reaching 13.5 million by 2021.
Russians: The Russian population in Kazakhstan grew significantly during the Soviet era due to industrialization and resettlement policies. However, following the collapse of the Soviet Union, many Russians emigrated, reducing their population from a peak of 6.2 million in 1989 to less than 3 million by 2021.
Ukrainians: Ukrainian population in Kazakhstan also increased during the Soviet period due to deportations and resettlement, but has significantly decreased since independence.
Germans: The German population in Kazakhstan saw a sharp increase during World War II due to deportations, but has significantly decreased since the 1990s as many Germans emigrated to Germany. From a peak of 659,000 in 1959, the German population has dwindled to 226,000 by 2021.
Koreans: Koreans were deported to Kazakhstan in large numbers in 1937 from the Russian Far East. Their population has steadily grown over the years, reaching 118,000 by 2021.
Figure 2: Chronology of changes in the national composition of Kazakhstan
Conclusion
The ethnic composition of Kazakhstan is a reflection of its complex history, shaped by migration, industrialization, and geopolitical changes. The visualizations presented here provide a detailed look at the current distribution of ethnic groups, the regions where different groups form the majority, and how these demographics have changed over time. This analysis can serve as a basis for understanding Kazakhstan's socio-cultural dynamics and for formulating policies that respect and address the needs of its diverse population.
Code and Resources
The entire project code and data are available on GitHub: