
Demographic Analysis of Kazakhstan: Natural Growth and Birth Trends
In this project, I created two visualizations showcasing demographic changes in Kazakhstan. The first map displays the natural population growth by regions for 2023, while the second chart illustrates the number of births by year since independence.
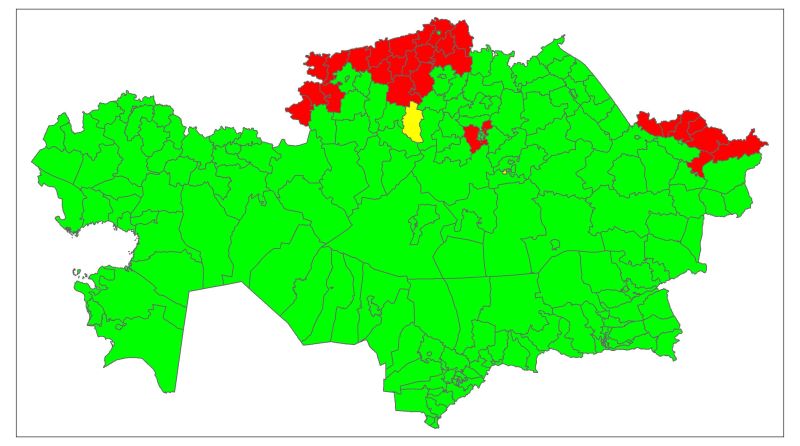
Natural Population Growth by Regions in 2023
I developed this visualization using the R programming language and the following libraries: devtools, geokz, dplyr, sf, tmap.
The color scheme of the map is as follows:
- Red ❤️: Population decrease.
- Yellow 💛: Stable population.
- Green 💚: Population growth.
Based on the data, 188 districts showed positive growth, indicating more births than deaths. 29 districts experienced a population decline, where the number of deaths exceeded the number of births. In 2 districts, the population remained stable with an equal number of births and deaths.
The district with the highest population growth is Karatau (Shymkent), with an increase of 8,947 people. The district with the highest population decline is Altai (East Kazakhstan), with a decrease of 456 people. The districts where the population remained unchanged are Zhaksy (Akmola Region) and Shakhtinsk (Karaganda Region).
Yearly Births in Kazakhstan Since Independence
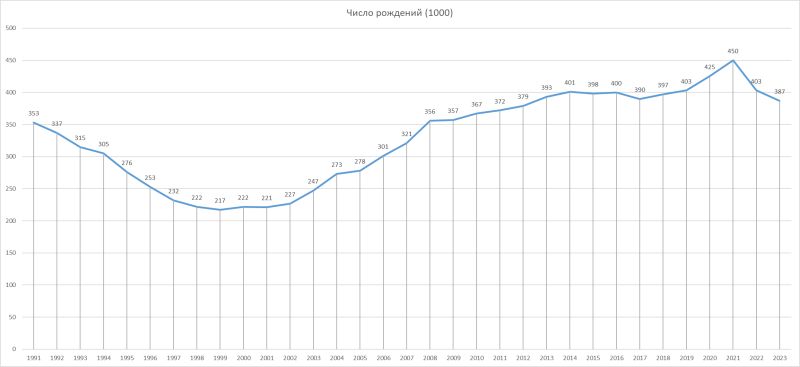
The chart, created using MS Excel, shows the number of births per year in Kazakhstan since 1991.
Key observations:
1. Decline in birth rates in the 1990s: In the early years of independence, from 1991 to 1999, there was a significant decline in the number of births 📉. This may be due to the economic and social challenges of the transition period.
2. Gradual recovery: Starting in the early 2000s, a gradual recovery in birth rates begins 📈. The number of births increased steadily from 222,000 in 2000 to 301,000 in 2006.
3. Peak birth rates: In 2008, the birth rate reached 356,000, one of the peaks in the period under review. In the following years, the birth rate remained relatively high, reaching a maximum of 450,000 in 2021.
4. Impact of the COVID-19 pandemic: The COVID-19 pandemic likely impacted birth rates. In 2020, the number of births was 425,000, slightly higher than in previous years, but by 2022, it had decreased to 403,000, and in 2023 to 387,000.
5. Stabilization of birth rates: In recent years, the number of births has stabilized at around 400,000, indicating a stabilization of demographic processes in the country ⚖️.
Conclusions
These two visualizations demonstrate significant demographic trends in Kazakhstan. On one hand, the map shows the distribution of natural population growth by region, while on the other, the chart reflects long-term changes in birth rates. These data help better understand demographic processes in the country and can serve as a basis for further research and decision-making at the state level.
Code and Data
The code for creating the map is available on GitHub, and the data for the chart is available on stat.gov.kz.