
In this project, I created an inhabitability map of Kazakhstan for the year 2023. This visualization was developed using the R programming language and libraries such as tidyverse, giscoR, and tidyterra.
Methods and Tools
The following tools and libraries were used for creating this visualization:
- tidyverse: A collection of packages for data manipulation and visualization.
- giscoR: A package for accessing and working with geographic data.
- tidyterra: A package for spatial data analysis.
Visualization Description
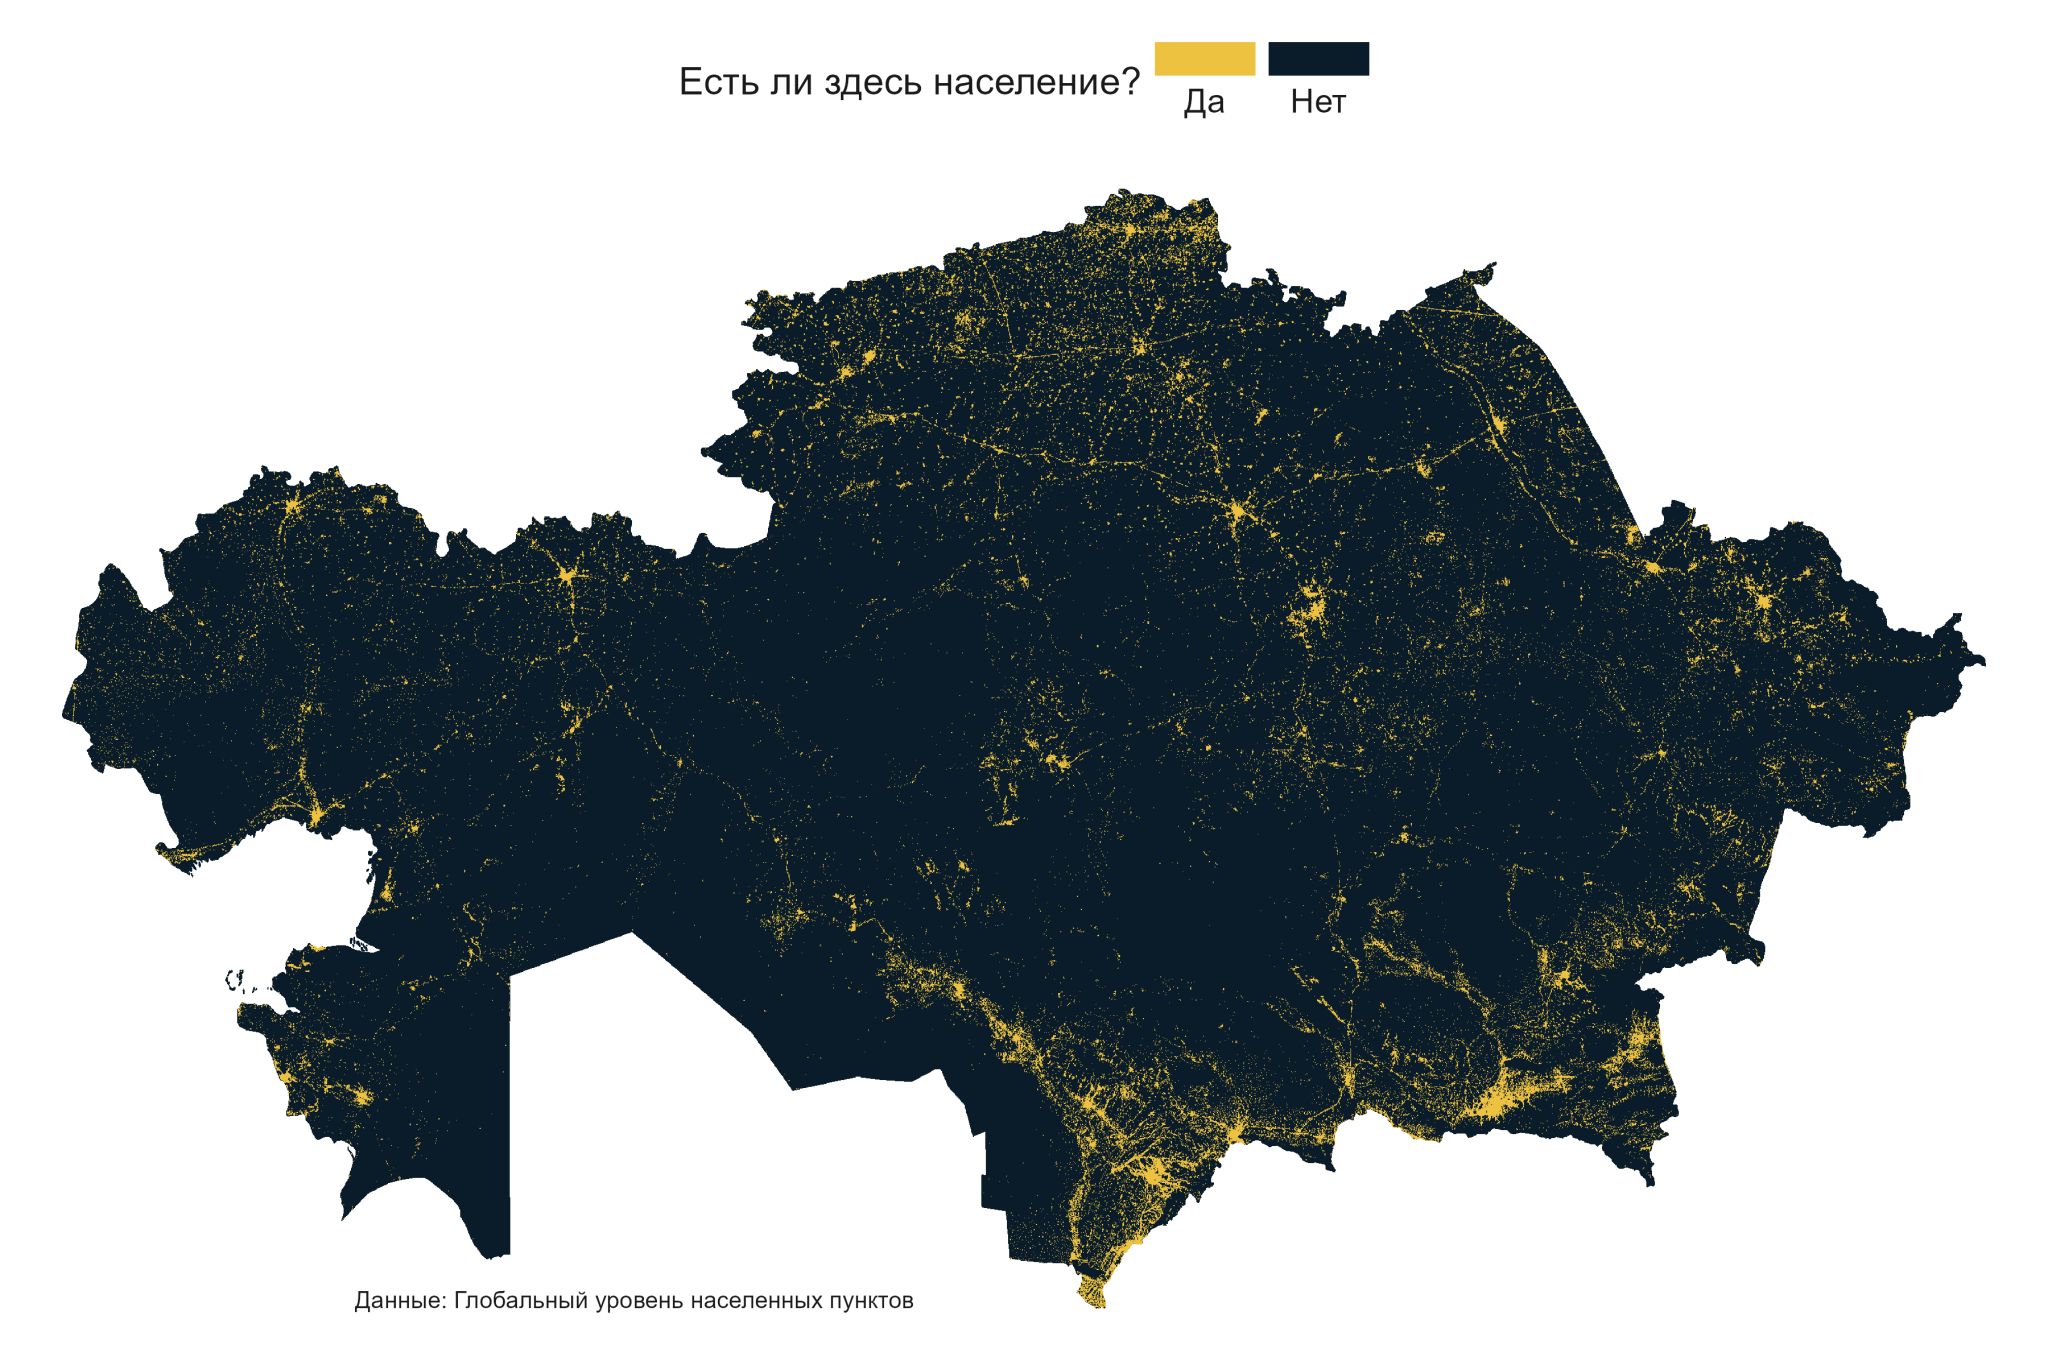
The map graphically represents inhabited and uninhabited areas in Kazakhstan. The yellow areas 🌝 represent regions where people live permanently, while the black areas 🌚 represent uninhabited regions. On the map, you can see the silhouettes of the Syr Darya, Irtysh, Ural, and Tobol rivers, as well as Lake Balkhash, due to the concentrated populations in these areas.
Analysis
Looking at the map, we can observe several key patterns:
1. The major rivers and water bodies such as the Syr Darya, Irtysh, Ural, and Tobol rivers, as well as Lake Balkhash, have clear silhouettes formed by the concentrated populations around them.
2. Urban areas are densely populated, which is evident from the bright yellow clusters representing cities and towns.
3. Large regions, especially in the central and western parts of Kazakhstan, remain uninhabited, depicted by the extensive black areas.
Conclusions
Analyzing the map allows us to understand the distribution of population in Kazakhstan. This insight can aid in planning and resource allocation, ensuring sustainable development across the country.
Code and Repository
The entire project code is available on GitHub.