
In this project, I created an age-sex pyramid for Kazakhstan. The visualization was developed using the R programming language and libraries such as ggplot2, dplyr, readr, and tidyr.
Methods and Tools
The following tools and libraries were used to create this visualization:
- ggplot2: A powerful data visualization package in R.
- dplyr: A grammar of data manipulation, providing a consistent set of verbs that help solve data manipulation challenges.
- readr: A package for reading rectangular data, such as csv, tsv, and fwf.
- tidyr: A package that helps create tidy data, where each variable is in a column, each observation is a row, and each value is a cell.
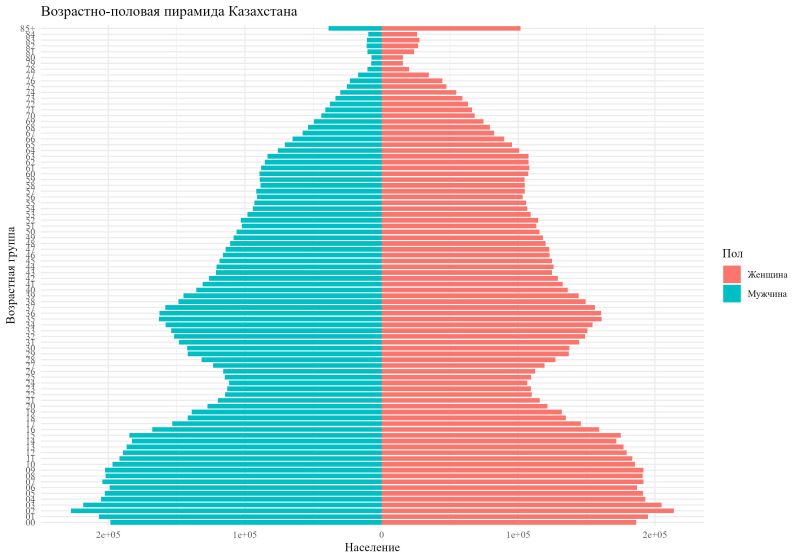
Visualization Description
The age-sex pyramid graphically represents the population distribution by age and sex in Kazakhstan. The overall population is divided into 9,783,814 men 👨 and 10,250,028 women 👩.
Conclusions
Analyzing the pyramid allows us to draw several key conclusions:
1. A high proportion of youth (0-15 years) indicates a high birth rate, suggesting a growing young population. 👶
2. The narrowing of the pyramid in the age groups from 20 to 35 years may be due to migration, youth outflow, or changes in birth and death rates within these age groups. 🚶♂️
3. Gender imbalance: The higher number of women in older age groups reflects longer life expectancy among women. 👵
Code
The entire project code is available on GitHub.