
In this project, I created a population density map for the districts of Kazakhstan. The visualization was developed using the R programming language, utilizing libraries such as geokz, dplyr, and sf.
Methods and Tools
The following tools and libraries were used for creating this visualization:
- geokz: A package for accessing Kazakhstan's geographic data.
- dplyr: A package for data manipulation.
- sf: A package for handling spatial vector data.
Population Density Overview
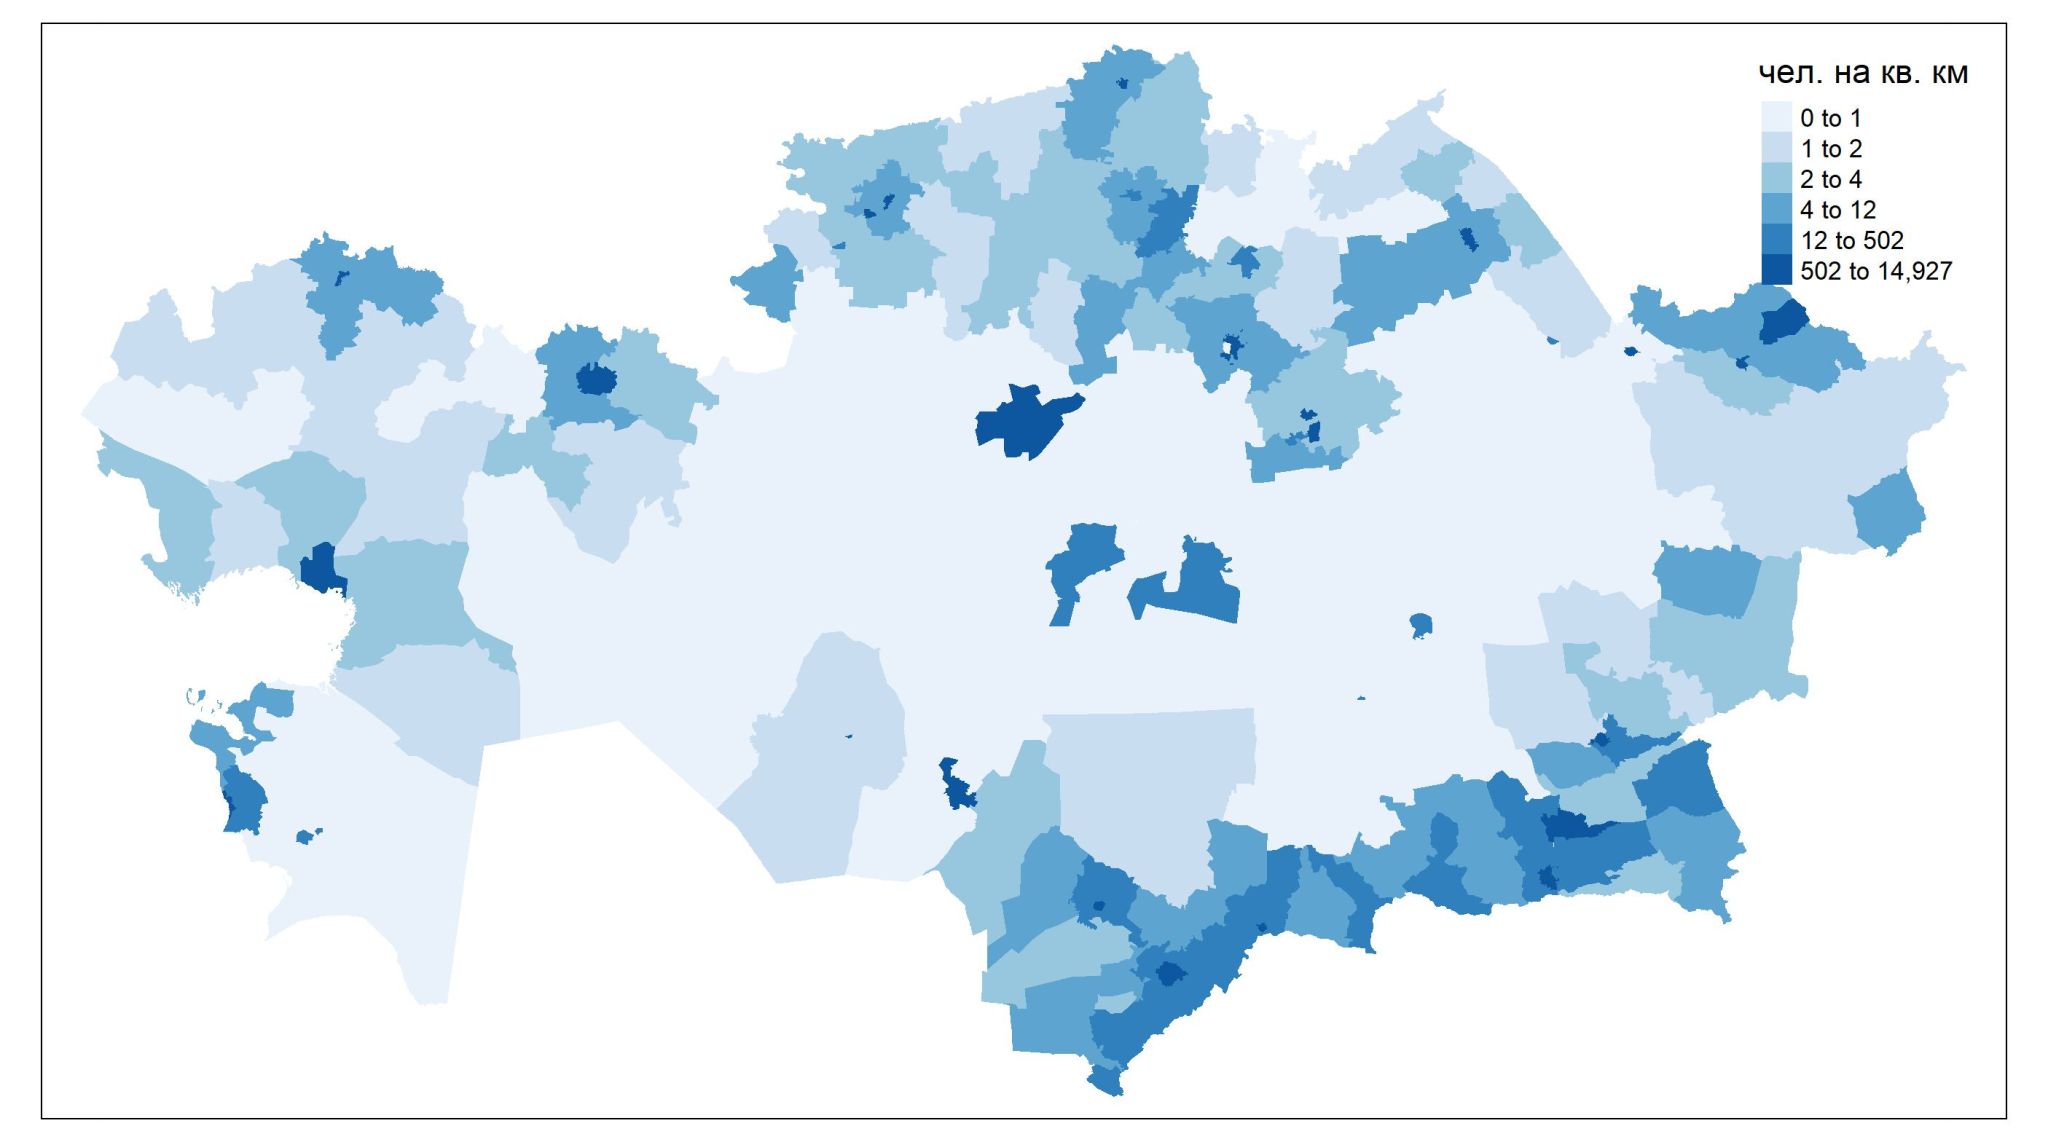
The map graphically represents the population density across various districts in Kazakhstan. Areas with the highest population density include:
1. Auezov (Almaty): 14,927 people per square kilometer.
2. Almaty (Almaty): 14,833 people per square kilometer.
3. Zhetisu (Almaty): 5,374 people per square kilometer.
4. Saryarka (Astana): 5,166 people per square kilometer.
5. Arkalyk (Kostanay): 3,787 people per square kilometer.
Low Density Areas
Conversely, areas with the lowest population density include:
1. Ulytau (Ulytau): 0.091 people per square kilometer.
2. Zhangeldin (Kostanay): 0.279 people per square kilometer.
3. Aktogay (Karagandy): 0.304 people per square kilometer.
4. Kyrgyz (Aktobe): 0.336 people per square kilometer.
5. Shalkar (Aktobe): 0.347 people per square kilometer.
Conclusions
The overall population density of Kazakhstan is 7.37 people per square kilometer, placing it 184th among 194 countries worldwide. This visualization provides valuable insights into the population distribution across the country, which is crucial for urban planning, resource allocation, and regional development strategies.
Code
The entire project code is available on GitHub