
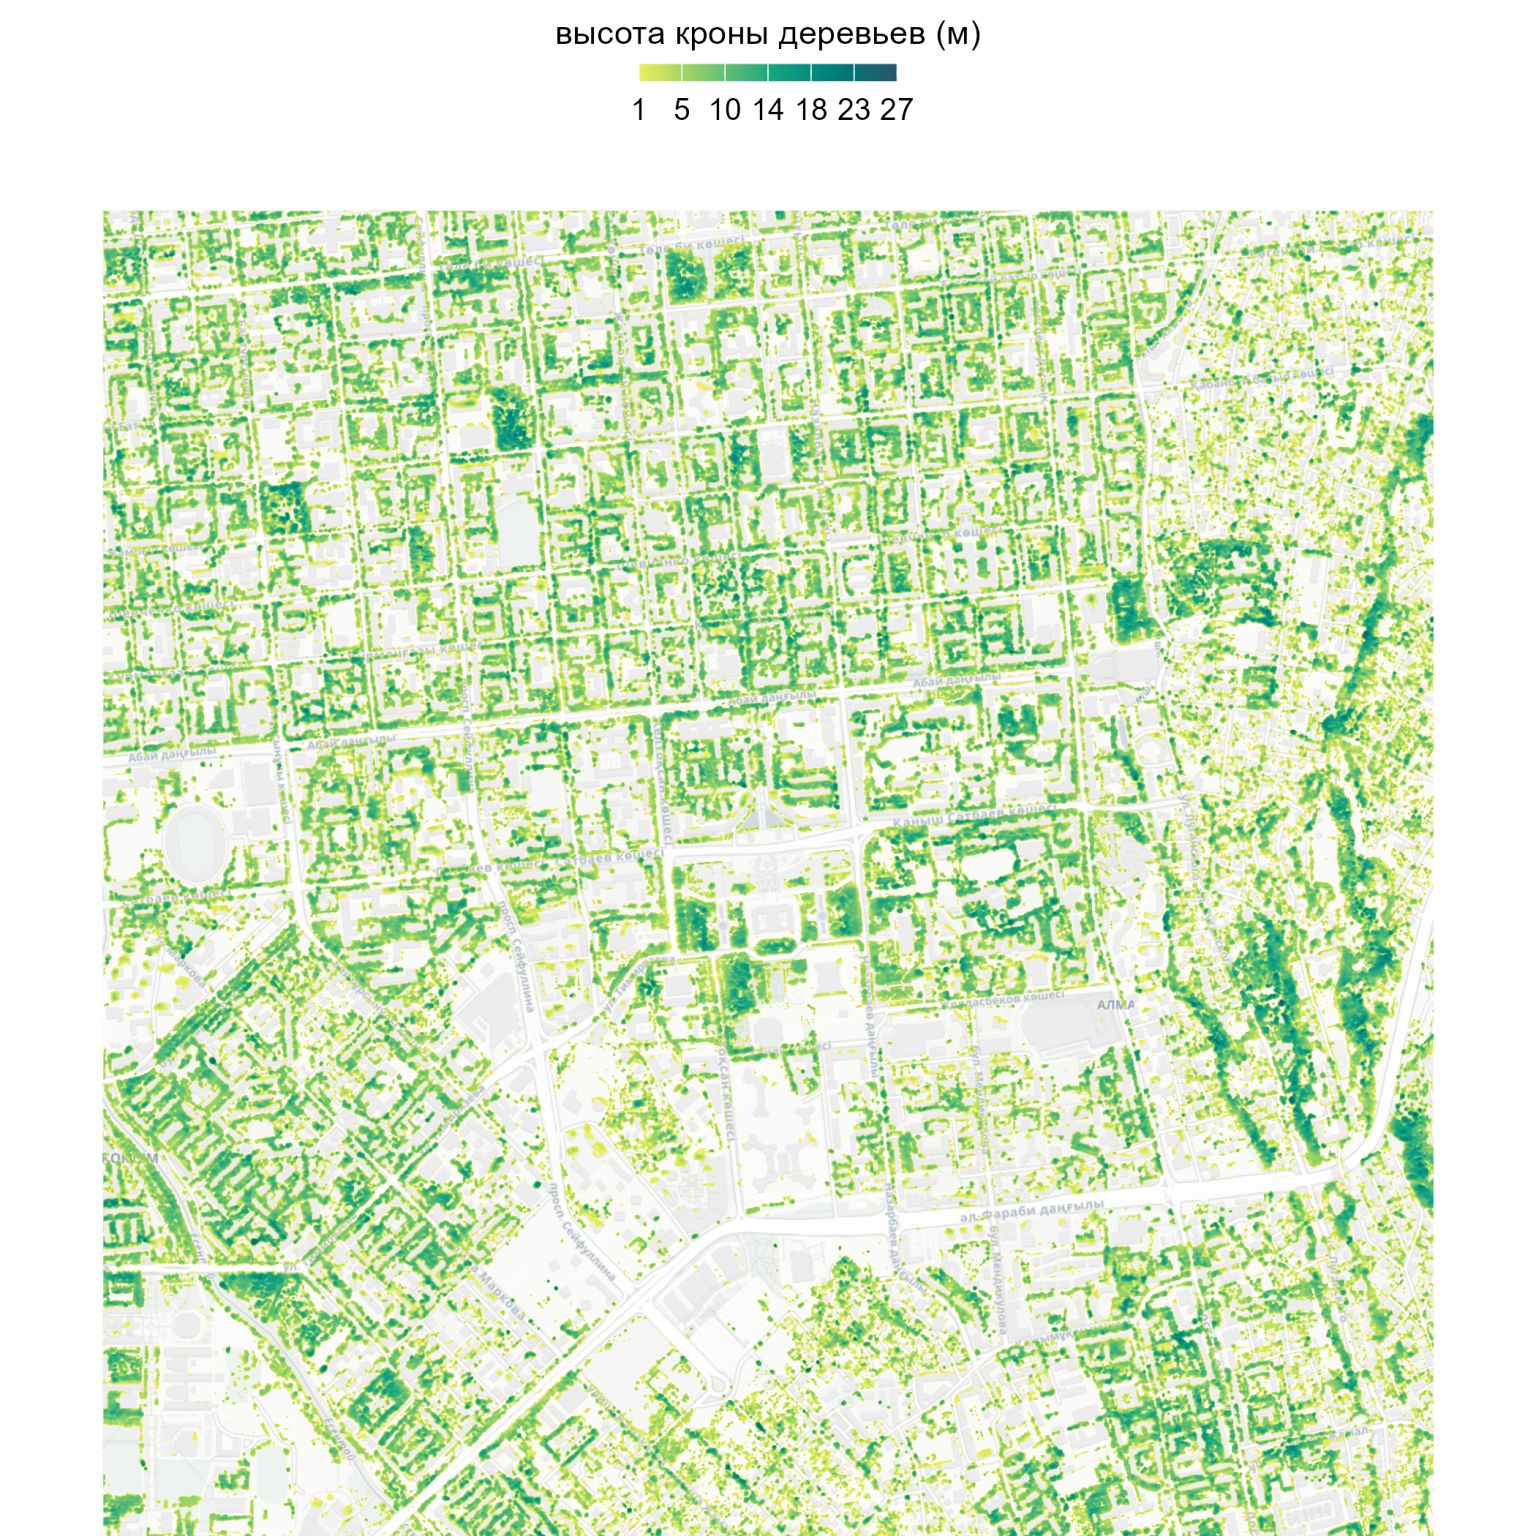
In this project, I measured the canopy height of trees in Almaty 🌳. The visualization was developed using the R programming language and the following libraries: chmloader, terra, sf, maptiles, classInt, tidyverse, tidyterra, leaflet, and htmlwidgets.
Context: The darker the green color on the map, the higher the tree canopies. Canopy height refers to the height of the upper layer of vegetation in a forest or another ecosystem, typically measured from the ground to the tops of trees or other plants. It's a crucial metric in forestry, ecology, and environmental research because it can indicate the forest's age, health, and structure.
Importance of Measuring Tree Height
Measuring the height of trees is important for several reasons:
- Plant Health Assessment: It allows for the detection of diseases, stress conditions, or damage.
- Determining Age Structure: Indicates the age of trees, essential for assessing their condition and care needs.
- Evaluating Ecosystem Role: Connected to the trees' ability to capture carbon, provide shade, and offer shelter to wildlife.
- Urban Planning: Helps assess green spaces and their contribution to the urban environment.
- Monitoring Landscape Changes: Tracks the growth and health of trees for sustainable management of forests and urban green areas.
Code Explanation
The full project code is available on GitHub. Below is a brief explanation of the main parts of the code used in this project:
1. Loading the Data
The code begins by loading the necessary libraries and data. The `chmloader` library is used to load canopy height model (CHM) data, which provides the height information for the trees. The `terra` library is used for spatial data processing, and `sf` is employed for handling spatial features.
    library(chmloader)
    library(terra)
    library(sf)
    # Load the canopy height model (CHM)
    chm <- rast("path_to_chm_data.tif")
2. Preparing the Data
After loading the CHM data, the code processes it using the `terra` package. The CHM data is reprojected to match the coordinate system of the base map tiles, and specific spatial transformations are applied to prepare it for visualization.
    # Reproject the CHM data
    chm_reproj <- project(chm, "EPSG:4326")

    # Prepare the data for mapping
    chm_clipped <- crop(chm_reproj, extent_of_area)
    chm_masked <- mask(chm_clipped, mask_shapefile)
3. Visualizing the Data
The visualization is created using `tidyterra`, `maptiles`, and `leaflet` libraries. These libraries allow for the integration of the canopy height data with basemap tiles, enabling an interactive and informative display of tree heights across Almaty. The darker green colors represent taller tree canopies.
    # Create a map with leaflet
    leaflet() %>%
      addProviderTiles(providers$CartoDB.Positron) %>%
      addRasterImage(chm_masked, colors = height_color_palette, opacity = 0.8) %>%
      addLegend("topright", pal = height_color_palette, values = values(chm_masked),
                title = "Canopy Height (m)")
4. Customizing the Map
The map can be further customized using different layers, color palettes, and interactive elements. The code also allows for adding markers, labels, and other map features to highlight specific areas of interest or provide additional context.
Conclusion
This project showcases the process of measuring and visualizing canopy height in an urban environment like Almaty. By utilizing R and various spatial analysis libraries, we can gain valuable insights into the city's green infrastructure and its role in the urban ecosystem. For more details and the full code, visit the project on GitHub.