
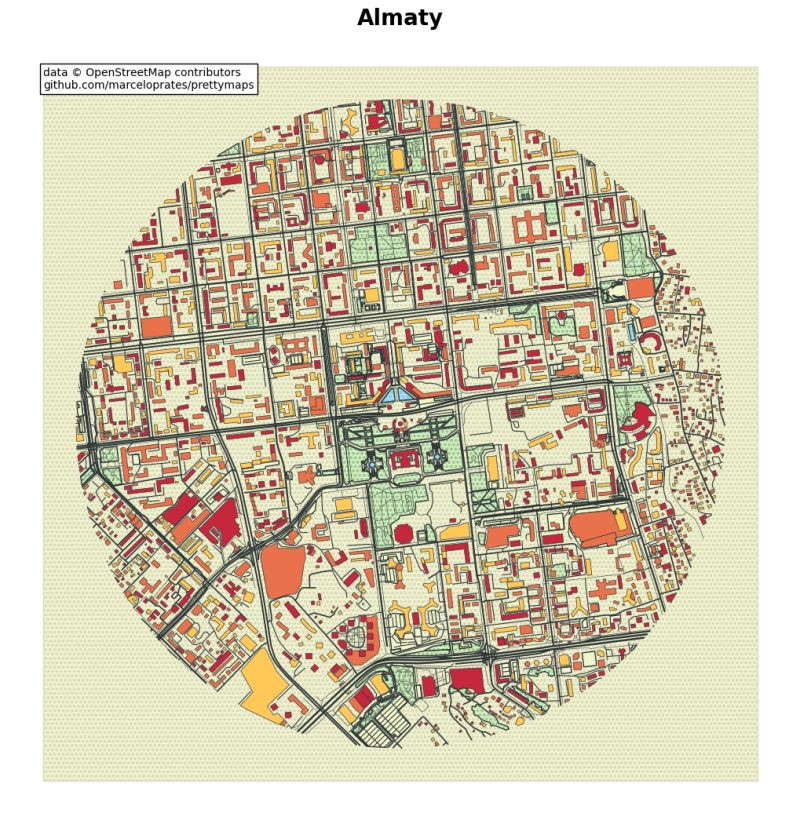
In this project, I visualized the city of Almaty using the PrettyMaps library in Python. PrettyMaps leverages data from OpenStreetMap to generate visually appealing maps that can be customized with various layers such as roads, buildings, parks, and more.
Step-by-Step Explanation
Below is a breakdown of the code used in the project, which you can find on my GitHub page. Each section of the code is explained to help you understand the process of creating a pretty map of Almaty.
1. Importing the Necessary Libraries
First, we need to import the necessary Python libraries. PrettyMaps is the key library here, along with matplotlib for plotting the map.
    import prettymaps
    import matplotlib.pyplot as plt
These imports allow us to access the PrettyMaps functions and configure our map display settings.
2. Setting the Map's Center
The next step is to define the central point of our map. In this example, the map is centered on the Akimat of Almaty, which is specified by its latitude and longitude coordinates.
location = (43.2567, 76.9286)
This line sets the coordinates for Almaty's city center. You can replace these coordinates with any other location if you wish to focus on a different area.
3. Creating the Pretty Map
With the location defined, we can now generate the map using PrettyMaps. The code below plots the map with a specified radius, which defines how much of the surrounding area is included.
    fig, ax = plt.subplots(figsize=(10, 10))
    prettymaps.plot(
        location,
        ax=ax,
        radius=2000,  # Radius in meters
        layers={'perimeter': {'circle': False}},
    )
    plt.show()
This block of code creates a map with a radius of 2 kilometers centered on the Akimat. The map displays various layers, including buildings, roads, and green spaces, providing a comprehensive view of the city's layout.
4. Customizing the Map
PrettyMaps offers many customization options. You can adjust the layers, colors, and styles to suit your needs. For instance, you can include additional layers such as water bodies or customize the color scheme to highlight specific features.
Conclusion
Visualizing cities with PrettyMaps allows for both artistic and analytical exploration of urban areas. The resulting maps are not only beautiful but also provide meaningful insights into the structure and layout of the city. This project demonstrates how you can leverage PrettyMaps to visualize any city in the world, with Almaty as a prime example.
Code
The full project code is available on GitHub.