
In this project, I created a cartogram of Kazakhstan's agricultural GDP for the year 2022 🌻. This visualization was developed using the R programming language with libraries such as pacman, geodata, sf, terra, tidyverse, classInt, and cartogram.
Methods and Tools
The following tools and libraries were used for creating this visualization:
- pacman: A package management tool for R.
- geodata: A package for working with geographic data.
- sf: A library for simple features, supporting spatial data analysis.
- terra: A library for spatial data analysis.
- tidyverse: A collection of packages for data manipulation and visualization.
- classInt: A package for class interval calculations.
- cartogram: A library for creating cartograms.
Visualization Description
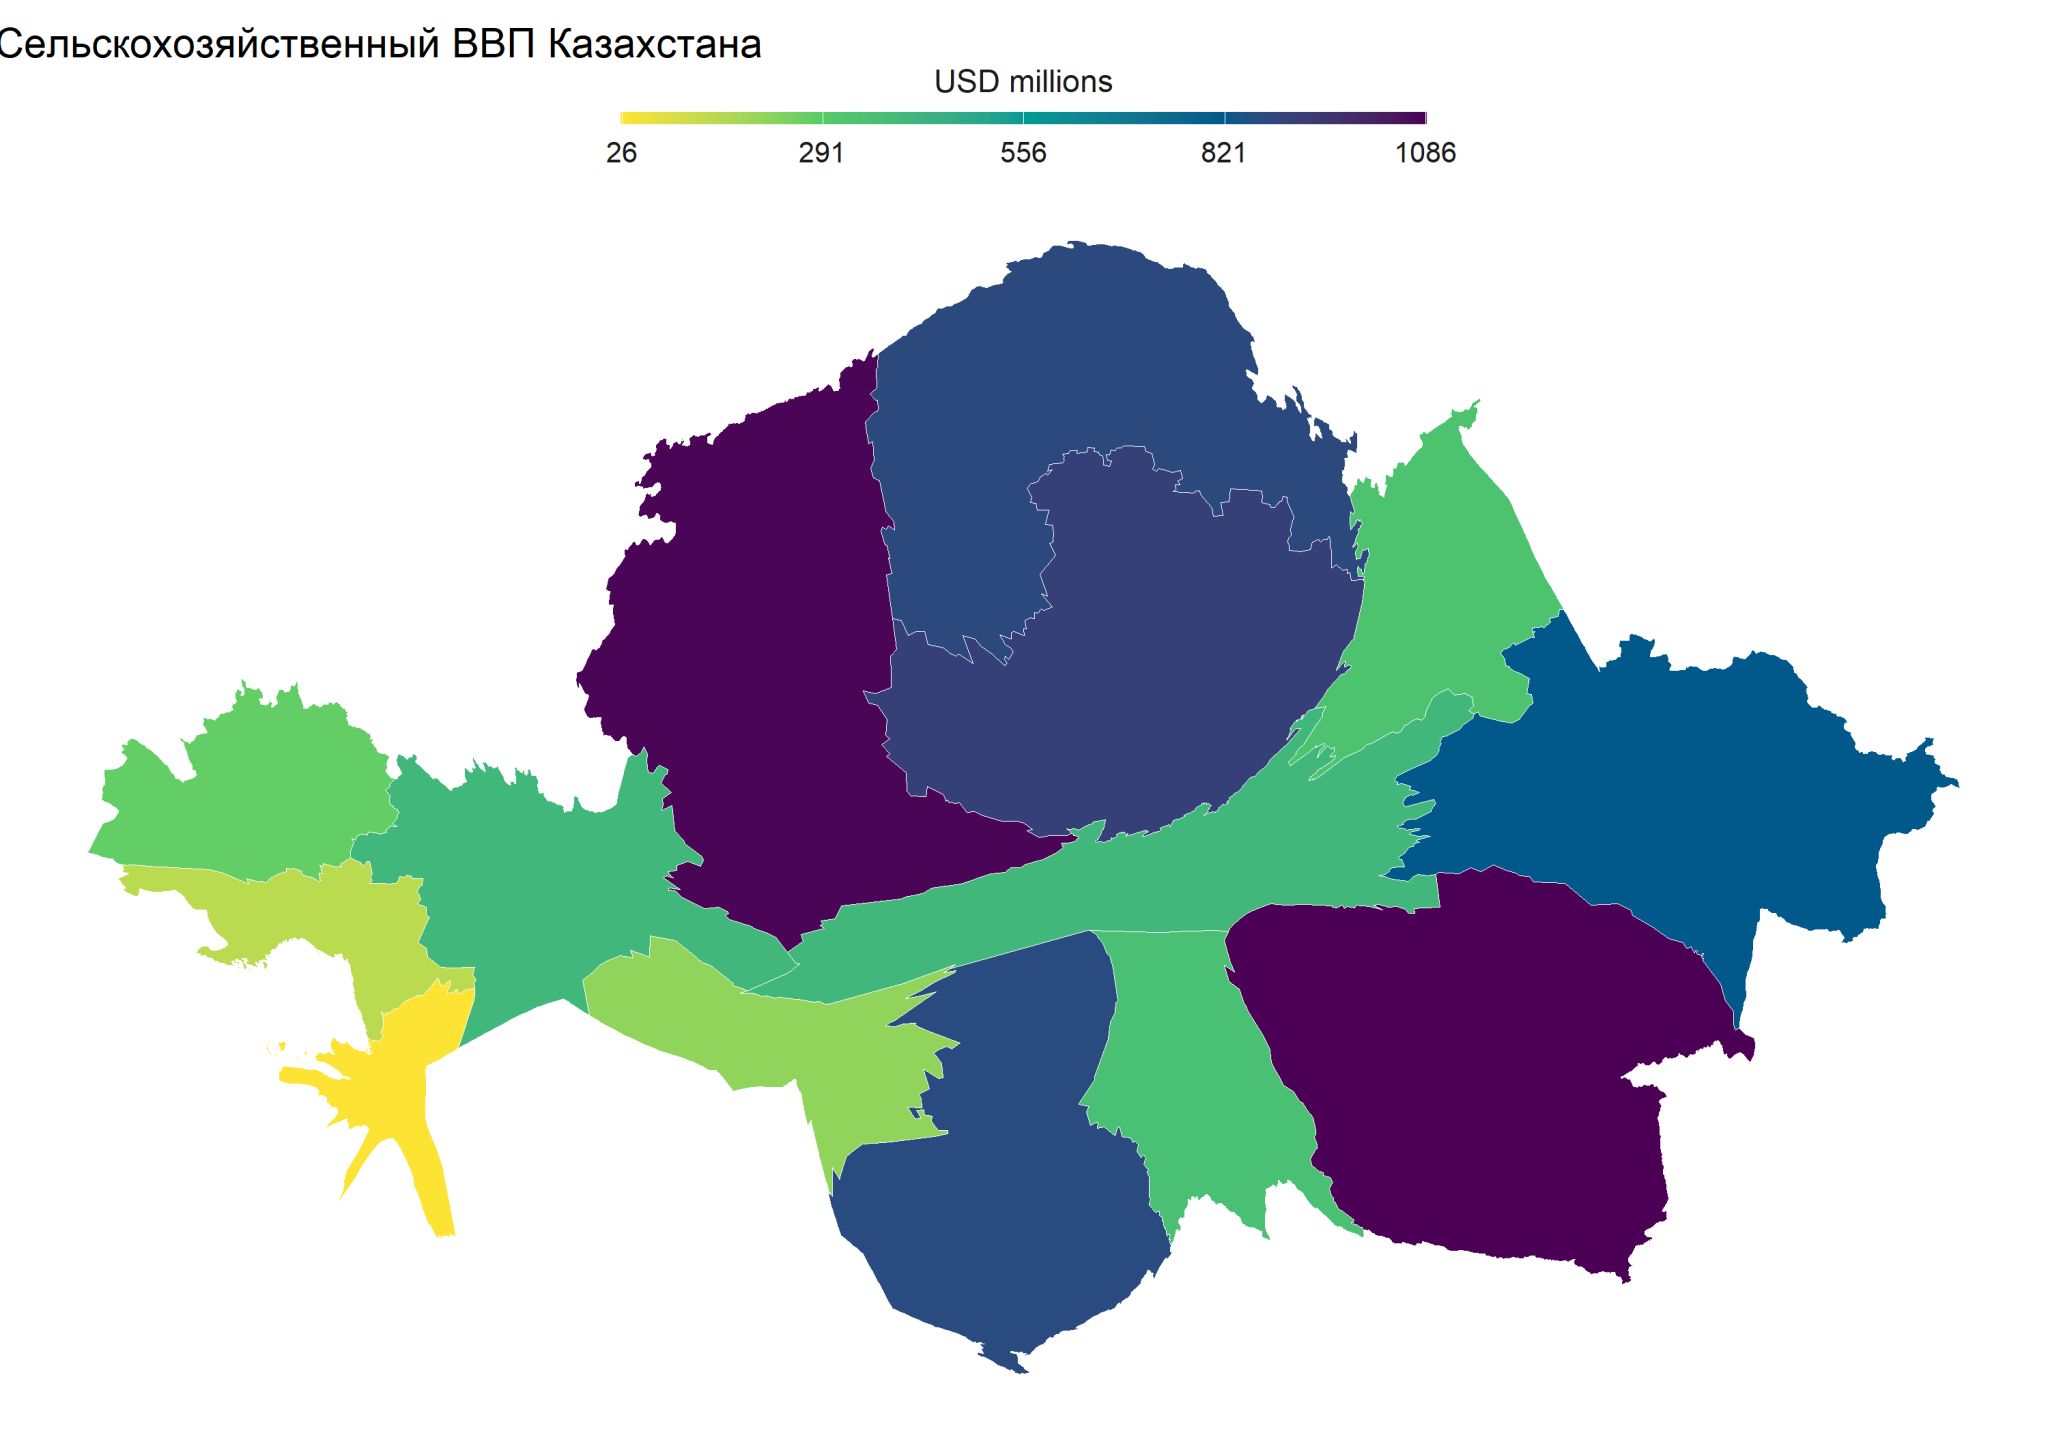
The maps graphically represent the agricultural GDP of Kazakhstan. The data is from 2022, and therefore the maps do not include any newly separated regions. The first map shows the agricultural sector GDP by region, while the second map shows the agricultural sector GDP per capita by region.
Conclusions
Analyzing these maps allows us to draw several key conclusions:
1. Kostanay and Almaty regions produce the most agricultural products, followed by Akmola and Turkistan regions.
2. On a per capita basis, North Kazakhstan region leads, followed by Kostanay region.
3. Agricultural GDP per capita is notably low in Central and Southern Kazakhstan.
4. Mangystau region shows the lowest results in both metrics.
.jpeg)
Agricultural GDP of Kazakhstan (per capita)
Resolution
This work highlights the disparities in agricultural production across Kazakhstan. The visualizations help to better understand the distribution of agricultural GDP and can serve as a foundation for further research and policy-making.
Code
The entire project code is available on GitHub