
In this blog, I will explain how to use Python and OpenStreetMap to create a visualization of the road network of a city. By using libraries like osmnx and matplotlib, we can produce a detailed map that shows the city's streets and analyze their structure.
Introduction
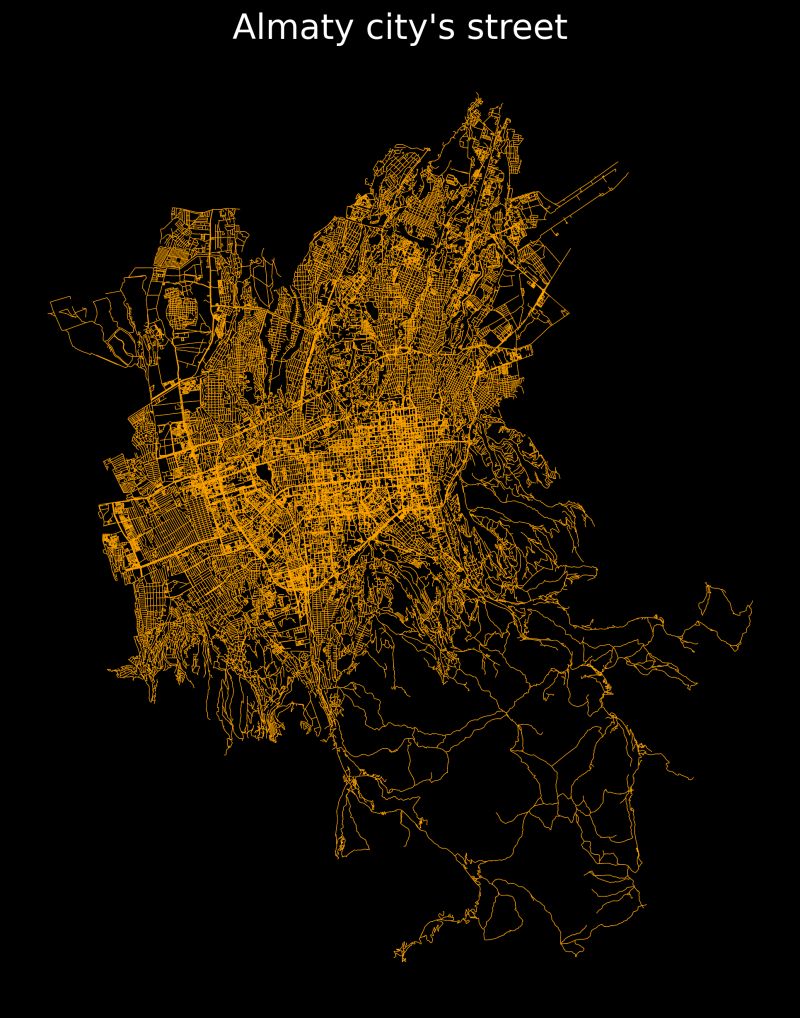
Recently, I created a map of Almaty's road network 🇰🇿. This visualization helps to better understand the city's structure, its development, and urban planning characteristics. Using osmnx (for OpenStreetMap data) and matplotlib (for visualization), I was able to create an image that shows all the streets in the city.
Preparing for the Task
Before we begin, you need to install the required libraries:
pip install osmnx matplotlib
Collecting Data
First, using the osmnx library, we'll fetch the road network data for Almaty:
import osmnx as ox
import matplotlib.pyplot as plt

# Get the road network graph for Almaty
G = ox.graph_from_place("Almaty, Kazakhstan", network_type="drive")

# Convert the graph to a geodataframe format
gdf_nodes, gdf_edges = ox.graph_to_gdfs(G)
Visualizing the Data
Now that we have the data, we can plot the map:
# Set the figure size
fig, ax = plt.subplots(figsize=(10, 10))

# Plot the streets
gdf_edges.plot(ax=ax, linewidth=0.5, color='black')

# Set the map title and remove axis ticks
ax.set_title("Road Network of Almaty", fontsize=20)
ax.set_xticks([])
ax.set_yticks([])
plt.show()
Analyzing the Map
After creating the map, several interesting patterns can be observed:
- City Center Density: The city center 🏙️ is much denser compared to the outskirts 🌳, which is typical for most large cities where the center is usually developed first and more intensively.
- Straight Streets in the Center: The center features more straight streets ↔️, while the outskirts have winding roads 🌀, reflecting the planning of central areas and adaptation to the landscape in newer areas.
- Suburban Areas: The map also shows suburban areas and rural roads 🚜, indicating the city's growth and integration with surrounding territories.
- Recognizable Landmarks: You can easily identify significant landmarks such as the Almaty Hippodrome 🐎, Sairan Lake 🌊, KazNU Campus 🎓, and Almaty Arena Stadium 🏟️.
- Grid Layout in Central Areas: The central areas are planned in a grid pattern, while newer areas are adapted to the landscape 🌄, showing the city's growth phases.
Conclusion
This visualization allows us not only to see the current structure of Almaty's road network but also to better understand its historical development. Using osmnx and matplotlib, you can create similar maps for any city, which opens up vast opportunities for analysis and research.
Code
The full project code is available on GitHub.