Paris 2024 Olympics Medals Analysis
The Paris 2024 Olympics mark another milestone in global sports history. By analyzing past medal data, we can identify trends, disparities, and key insights about how nations perform across different disciplines. This analysis provides a clear and visually engaging breakdown of the medals' distribution by country, type, and sport.
Key Insights
1. Total Medals by Country
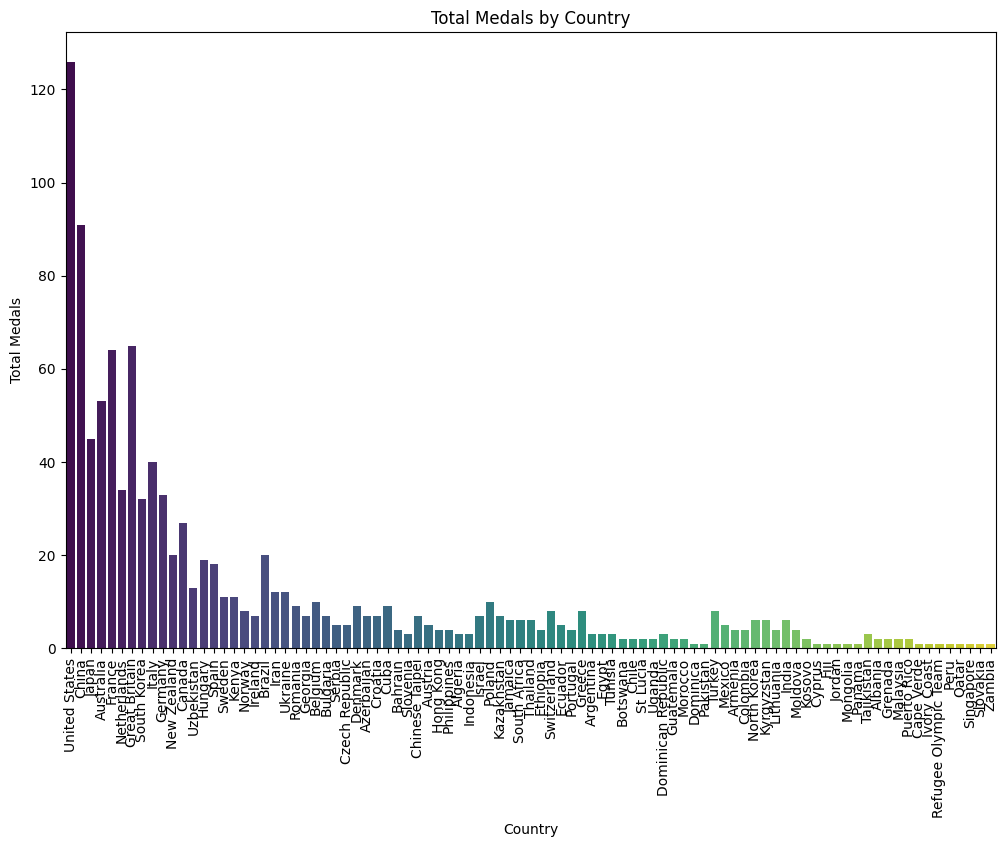
Medal counts reveal significant disparities between nations. The United States leads the pack, reflecting its consistent investment in sports. Meanwhile, other countries like China and Japan have steadily increased their presence, showcasing the growing competitiveness of international sports.
2. Medal Distribution by Type (Top 10 Countries)
.png)
Gold medals account for the largest share in most top-performing countries. This highlights the dominance of nations like the United States and China in excelling across various sports categories.
3. Medal Count by Type for Top 30 Countries

The top 30 countries account for a majority of the total medals, indicating an uneven global distribution of resources and training facilities. Countries such as Australia and Great Britain have diversified their efforts across numerous sports.
4. Distribution of Total Medals
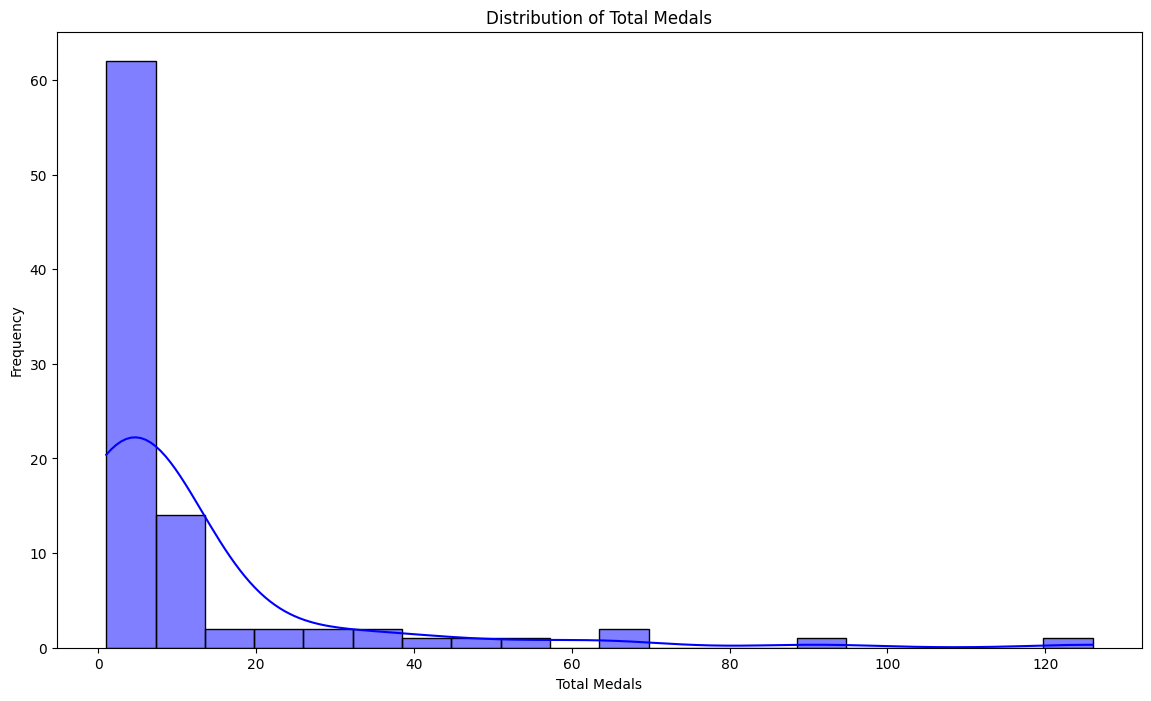
A histogram of total medals showcases the dominance of a few nations while most others remain at lower medal counts. This stark disparity emphasizes the need for increased support in underrepresented regions.
5. Heatmap of Medal Wins by Discipline and Country (Top 10)
.png)
This heatmap highlights the dominance of specific countries in various disciplines, such as swimming for the United States and athletics for Kenya. It showcases the specialization of countries in specific sports.
6. Top 5 Disciplines by Medal Count for Each Country (Top 15 Countries)
.png)
This bar chart displays the top 5 disciplines contributing to medal counts for each of the top 15 countries, emphasizing their focus areas and strengths.
7. Medal Count Proportion by Gender and Country (Top 20)
.png)
This visualization shows the proportion of medals won by male and female athletes in the top 20 countries, highlighting gender dynamics in global sports.
8. Age Distribution of Medallists by Discipline and Medal Type

Younger athletes dominate disciplines like gymnastics and swimming, while older athletes excel in shooting and equestrian events. This underscores the role of experience versus physical agility in different sports.
9. Age Distribution by Boxplot

The boxplot visualizes age ranges across various disciplines, showing that sports like rugby and athletics have a wide age range, while gymnastics remains concentrated among younger athletes.
10. Bubble Chart of Medal Distribution by Country and Discipline
.png)
Top countries like the United States and China exhibit a wide spread of medals across multiple disciplines. Such diversity indicates a strong and well-rounded sports infrastructure.
Conclusion
From medal distribution to athlete demographics, this analysis sheds light on the factors contributing to Olympic success. Countries with robust training systems and diverse sports programs tend to perform consistently well, while others have room for growth. The Olympics continue to be a platform for showcasing global talent and sportsmanship.
Explore More
For a deeper dive into the data and code, explore the full analysis:
Olympic Basic Visualizations Olympics 2024: 20 Visualizations