Top 1000 Global Tech Companies - Market Analysis
This analysis explores the distribution of market capitalization across industries and countries for the top 1000 global tech companies in 2024. With detailed visualizations, we uncover trends in industries, countries, and rankings, providing a comprehensive overview of the global tech landscape.
Key Insights
1. Distribution of Market Capitalization by Industry
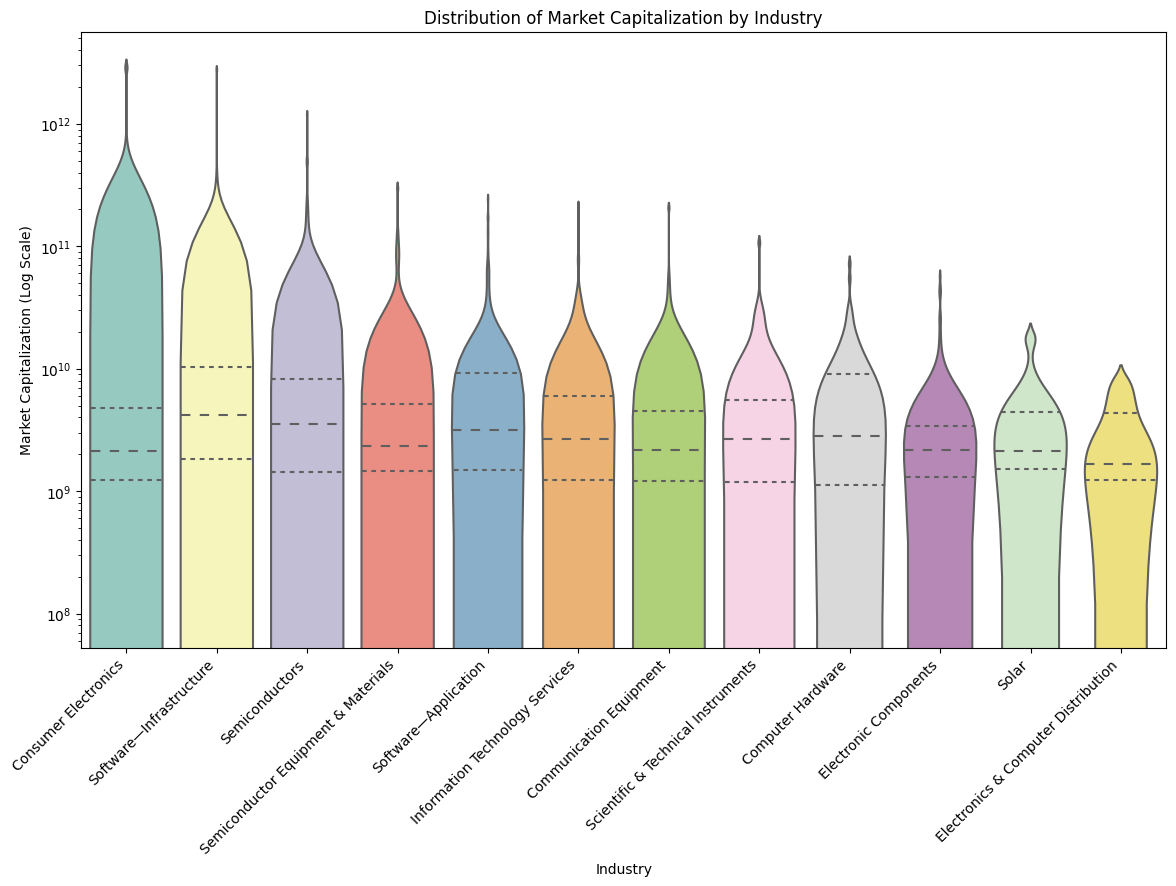
This visualization highlights how market capitalization is distributed across various industries. Consumer Electronics and Software lead the pack, indicating their dominance in the tech sector.
2. Cluster Map of Countries by Industry and Market Capitalization
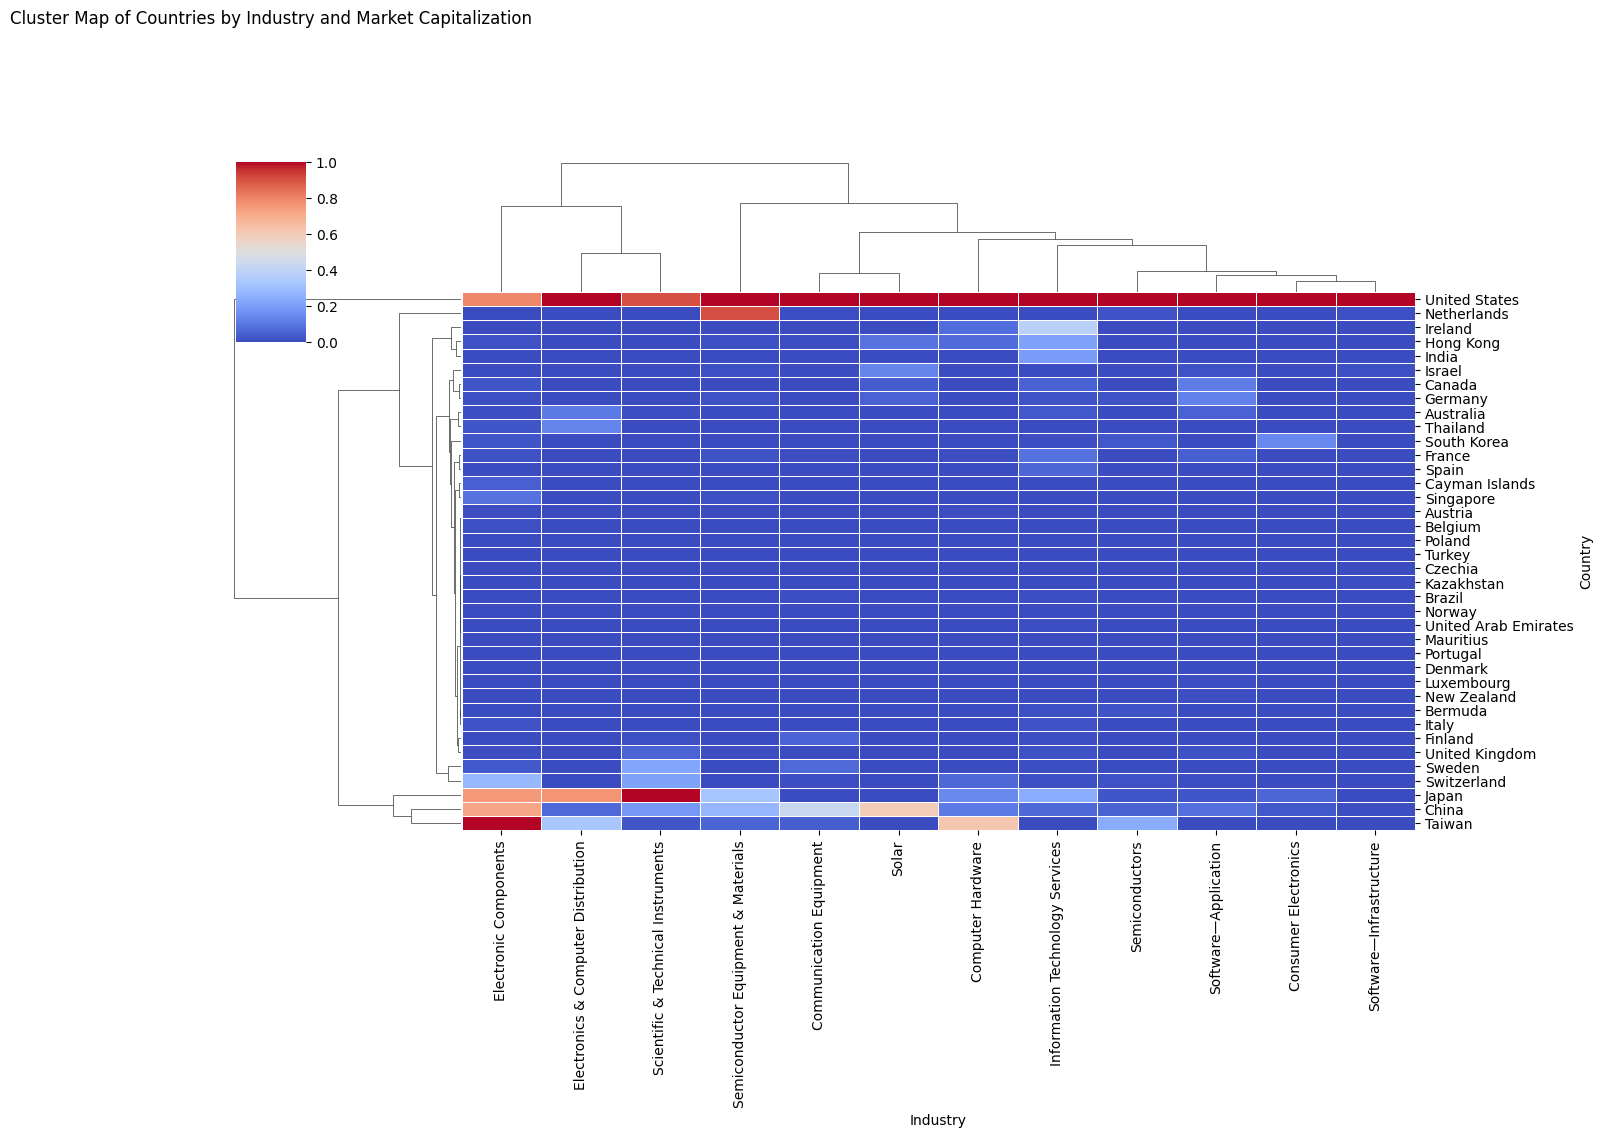
The cluster map reveals distinct groupings of countries based on their market capitalization and industry focus, showcasing the regional specializations and global tech hubs.
3. Market Capitalization by Ranking Across Different Industries
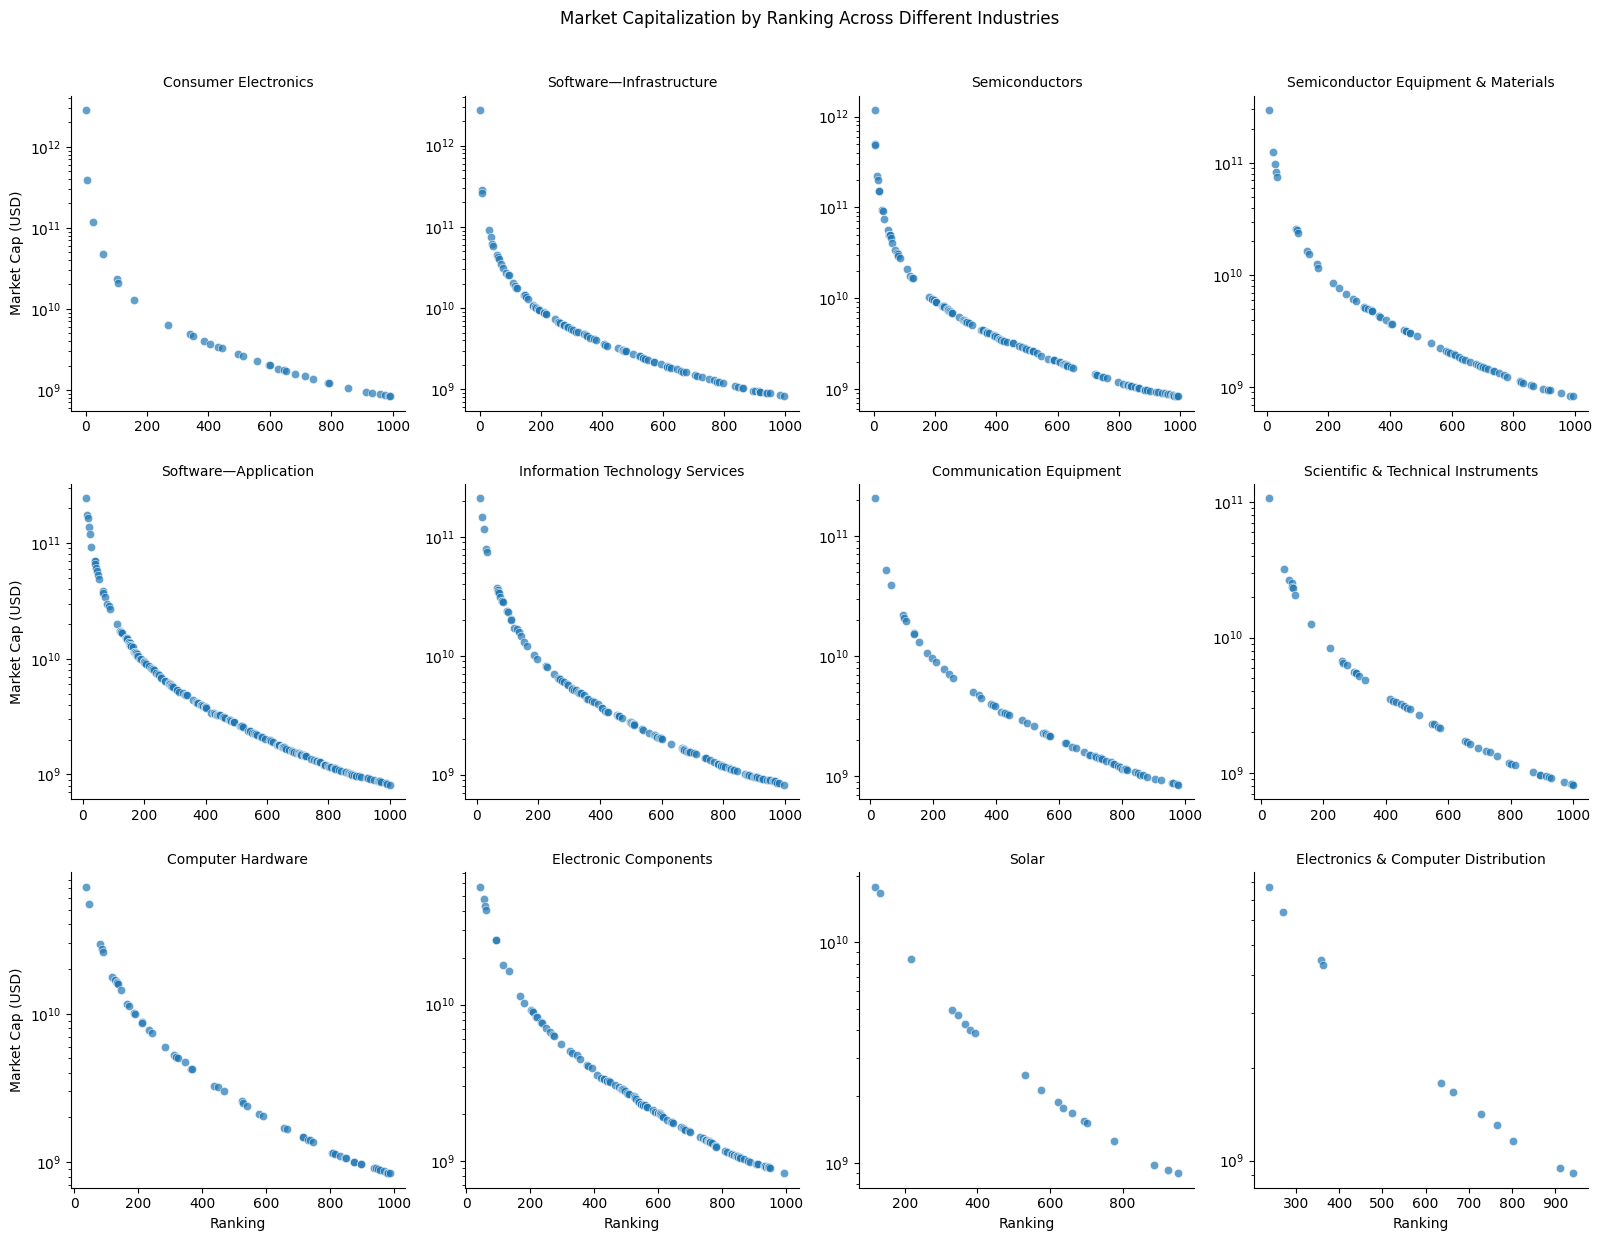
As ranking decreases, market capitalization declines exponentially, with top-ranking companies dominating the industry in terms of market value.
4. Market Capitalization Distribution by Industry
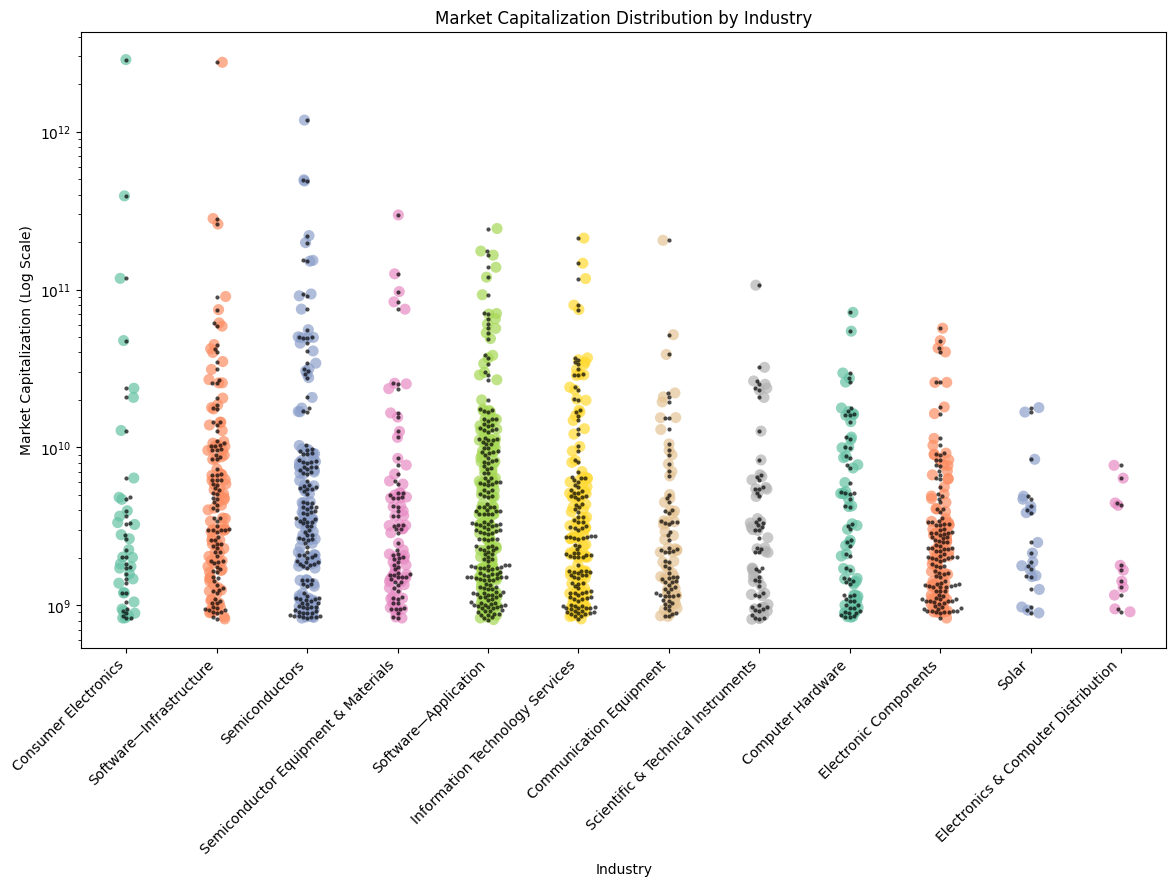
The scatterplot shows the concentration of market capital among top-performing companies, with smaller players distributed across lower market cap ranges.
5. Boxplot of Market Capitalization by Country
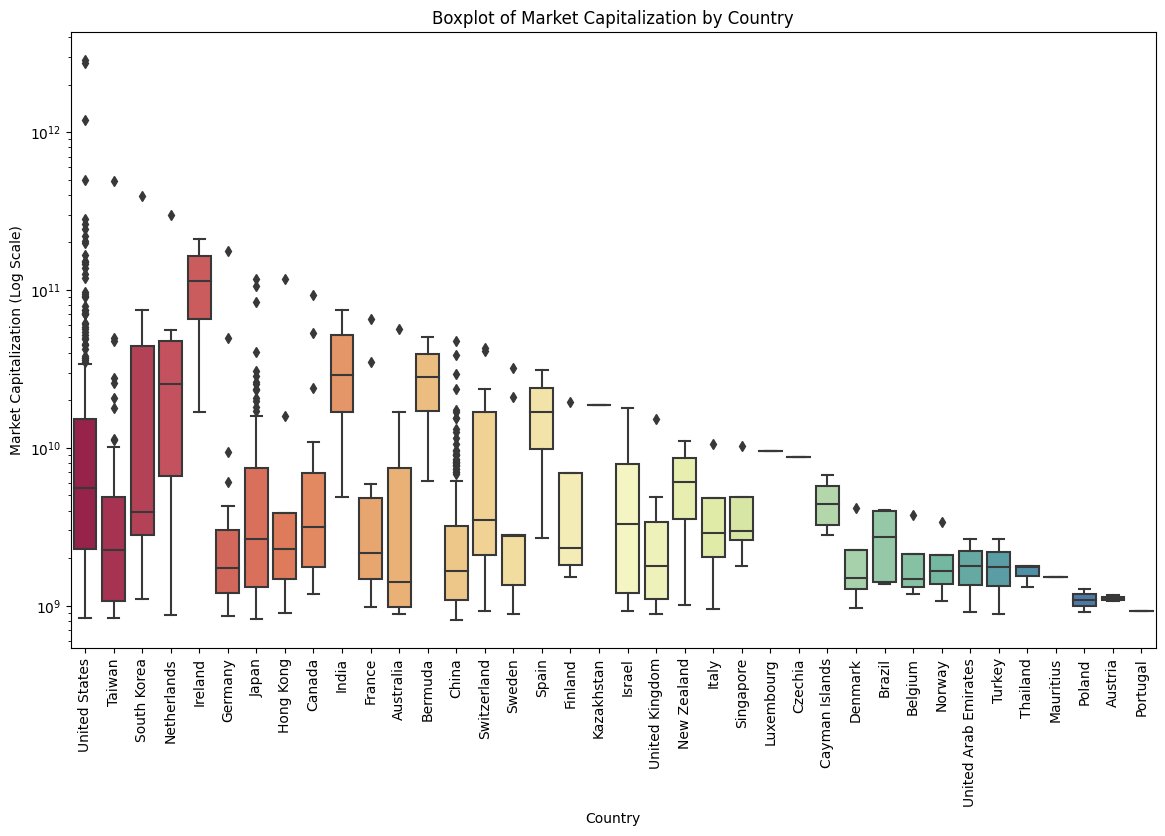
The United States leads with the highest median market capitalization, followed by China and Taiwan, highlighting their dominance in the global tech space.
6. Pointplot of Market Capitalization by Industry and Country
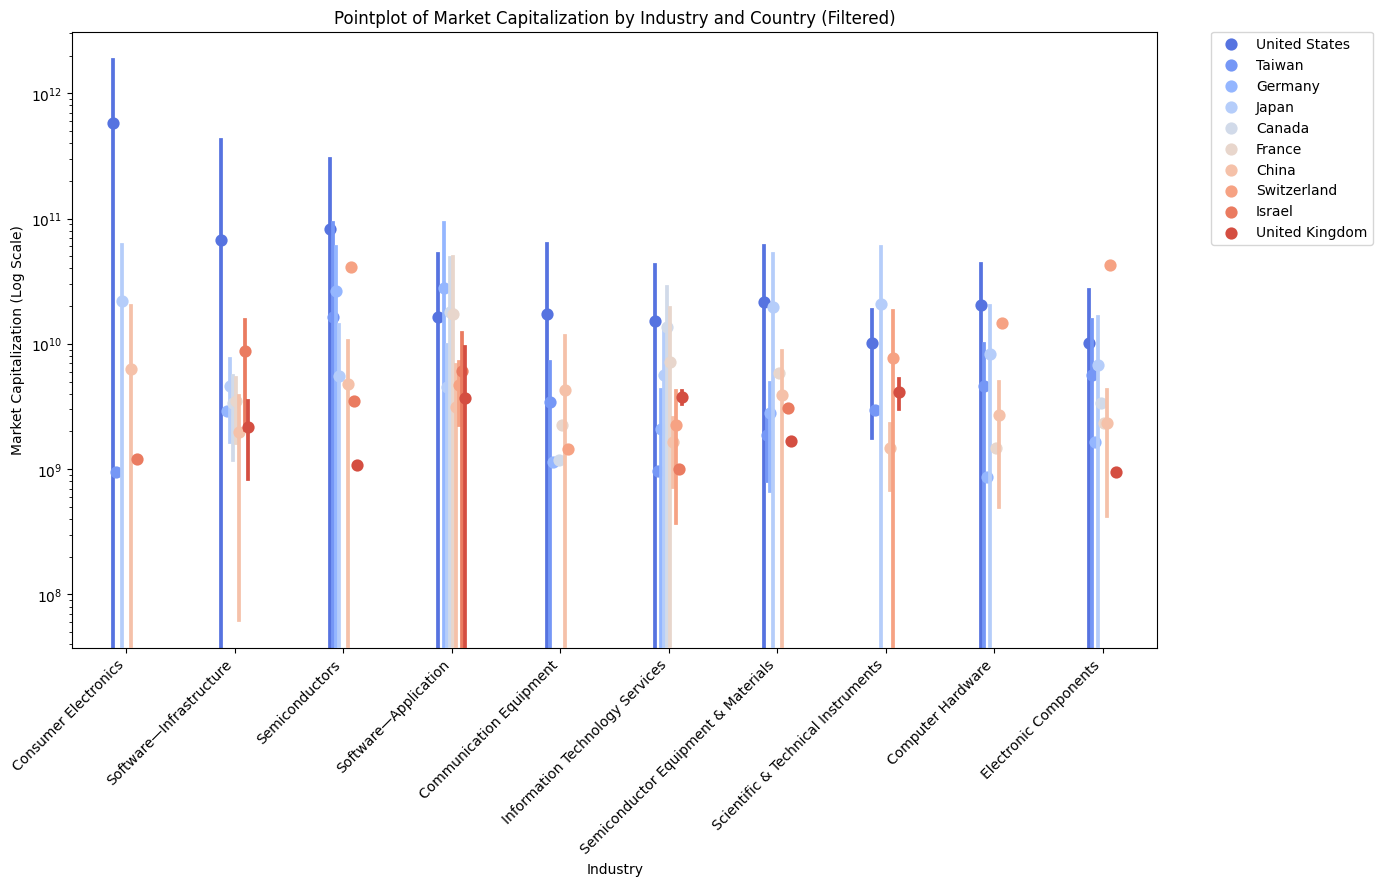
Pointplots illustrate the variance in market capitalization across industries for top countries, with the United States dominating in most sectors.
7. Heatmap of Average Market Capitalization by Industry and Country
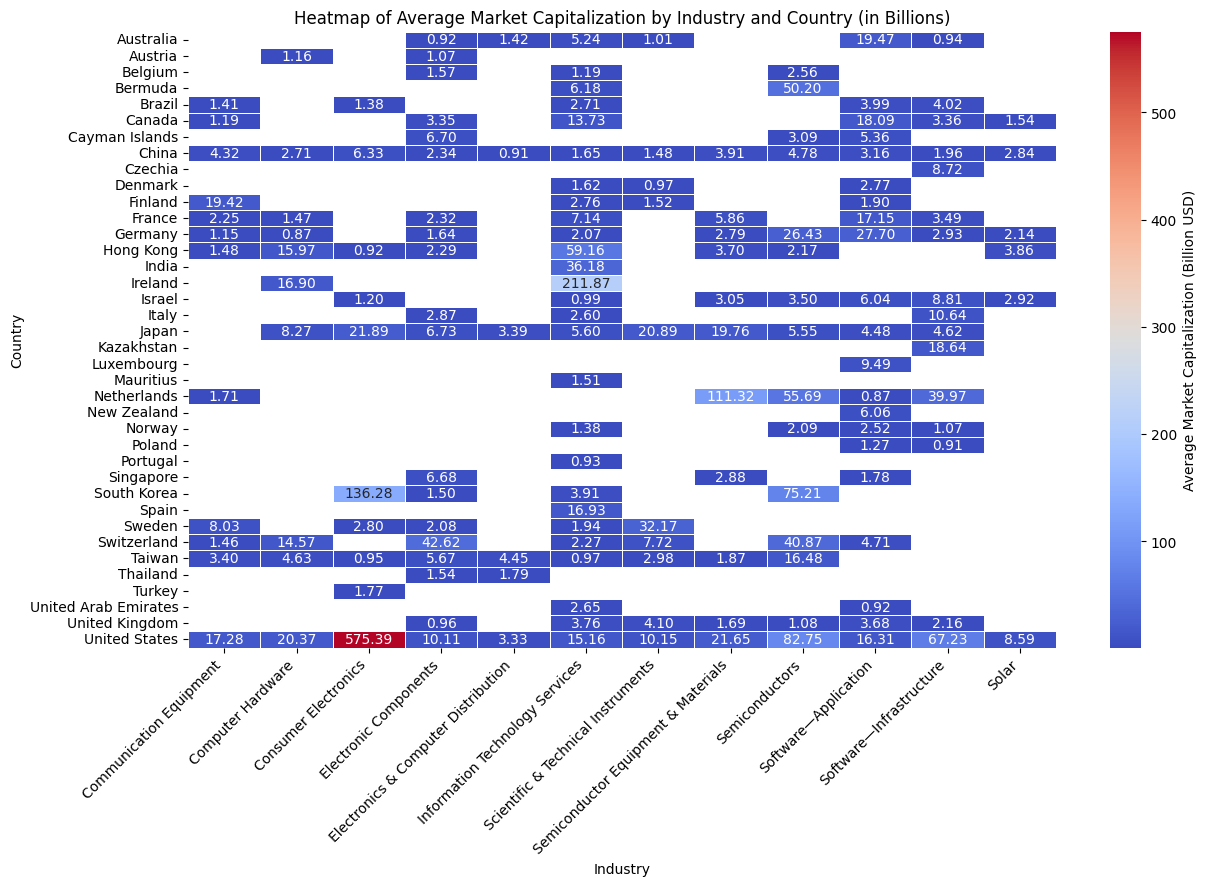
This heatmap provides a detailed breakdown of average market capitalization for each country across various industries.
8. Boxplot of Market Capitalization by Industry
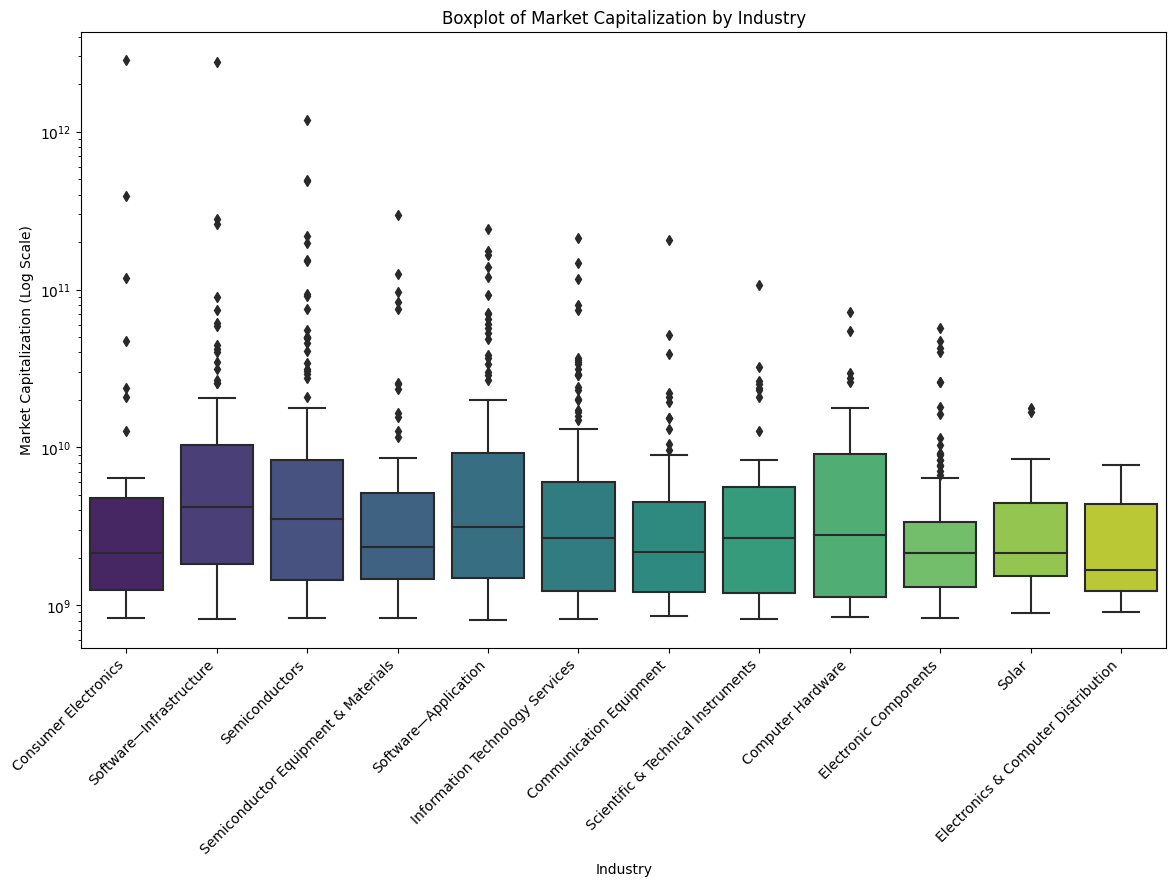
Boxplots reveal the interquartile range and outliers within each industry, showing substantial variability in market capitalization.
9. Boxenplot of Market Capitalization by Industry
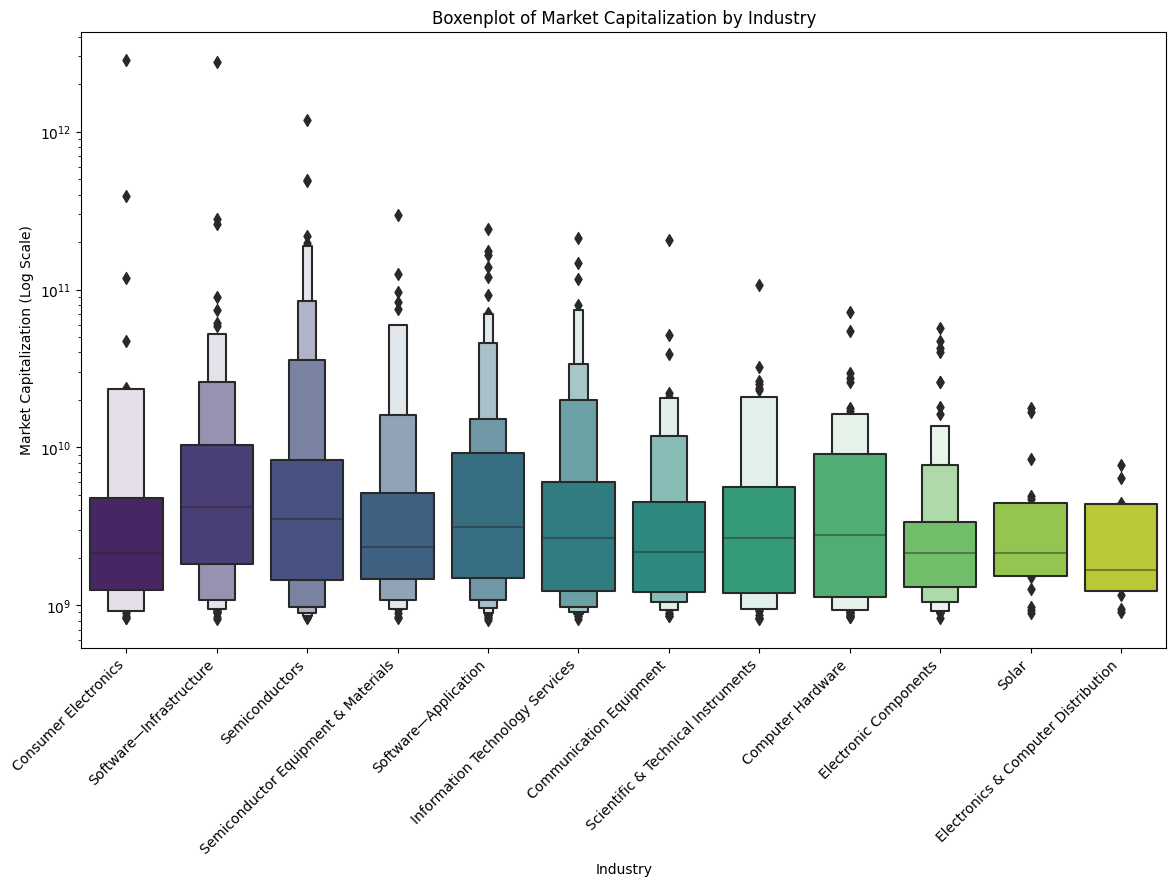
The boxenplot provides a closer look at the distribution of market capitalization among the largest companies within each industry.
Conclusion
The tech industry continues to evolve with significant contributions from various countries and industries. By analyzing market capitalization, we gain valuable insights into the driving forces of the global tech economy.
Explore More
For detailed data and code, visit the complete analysis:
Explore the Full Analysis