Google Play Store Data Analysis
The Google Play Store serves as a vibrant ecosystem for apps catering to billions of users worldwide. This analysis dives into key trends, uncovering insights about app categories, ratings, downloads, and pricing to better understand what drives success in this competitive marketplace.
Key Insights
1. App Distribution by Category
The "Games" and "Family" categories dominate the app landscape, reflecting their universal appeal. This creates both opportunities and challenges for developers aiming to stand out in these crowded segments.
2. Download Trends by Category
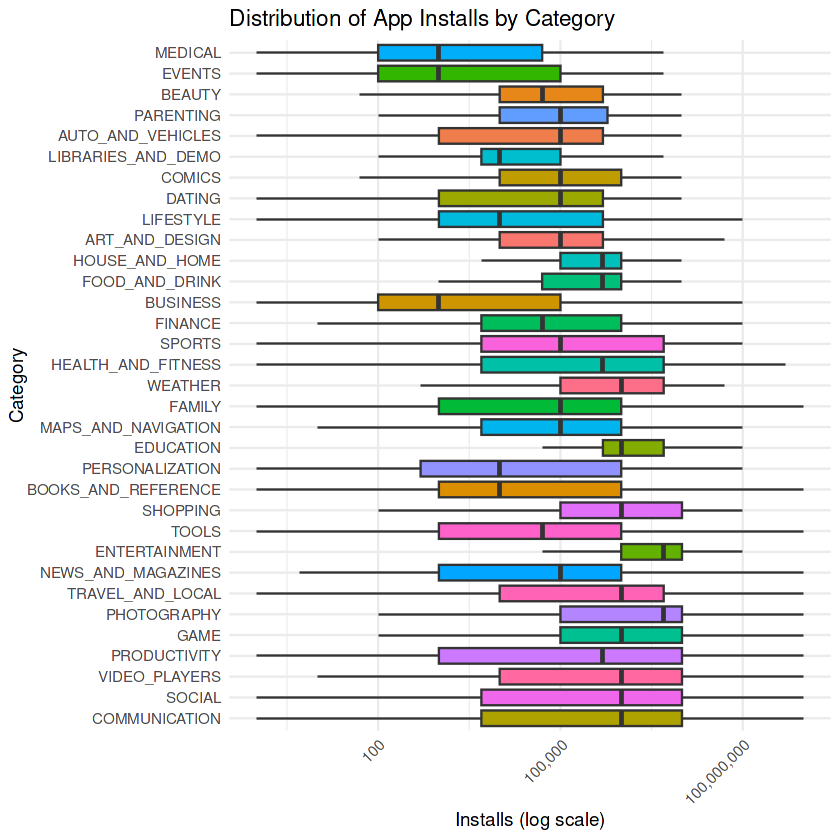
Entertainment and communication remain top priorities for users, as evidenced by the high install rates in the "Games" and "Social" categories. These insights can guide developers on user preferences.
3. Average Ratings Across Categories
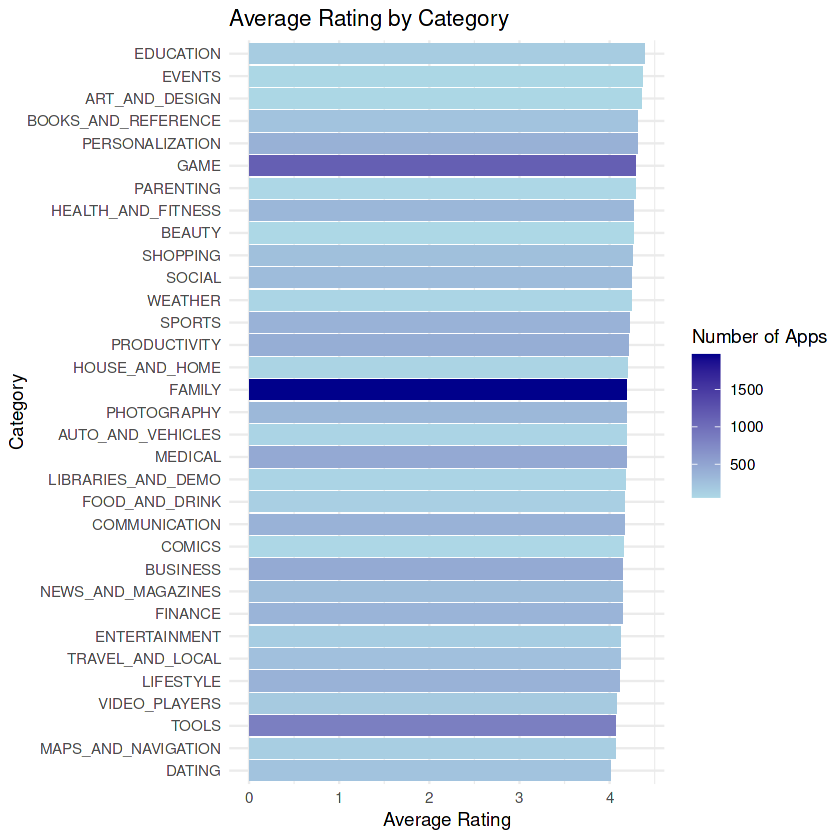
"Education" and "Events" apps boast the highest average ratings, underlining the value users place on quality and utility in these domains.
4. App Growth Over Time
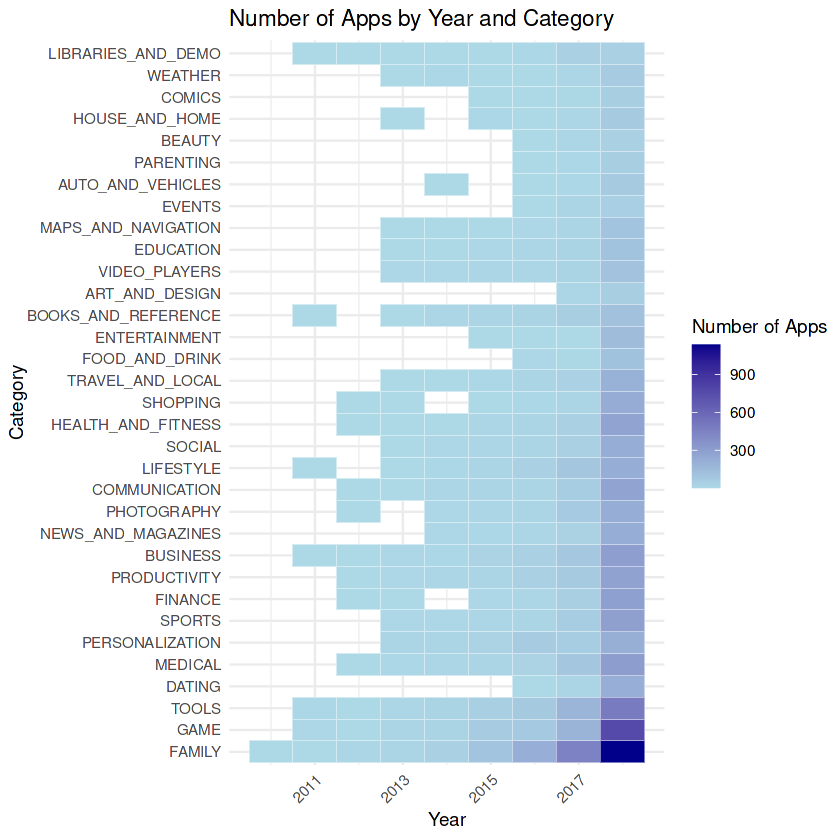
2017 witnessed a peak in app additions, driven by the growing smartphone adoption and the expanding developer ecosystem.
User Ratings and Feedback
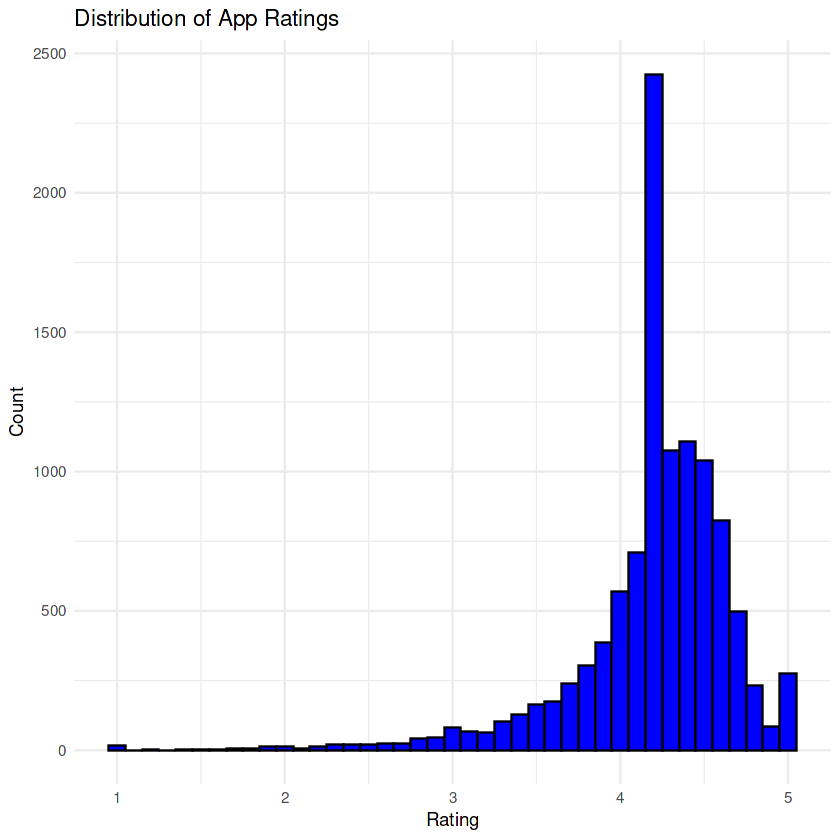
5. Distribution of Ratings
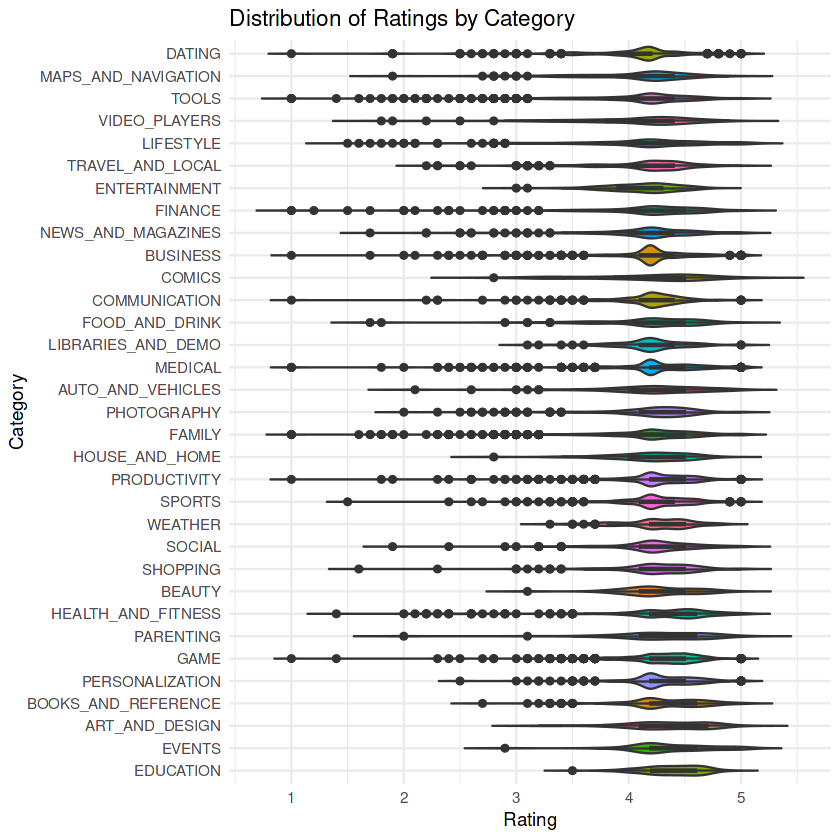
Most apps receive ratings above 4.0, highlighting the competitive quality standards in the store. However, outliers still exist, offering improvement opportunities.
6. Ratings Based on App Type

Paid apps consistently achieve higher ratings than free apps, reflecting their targeted user base and enhanced feature sets.
Factors Driving App Success
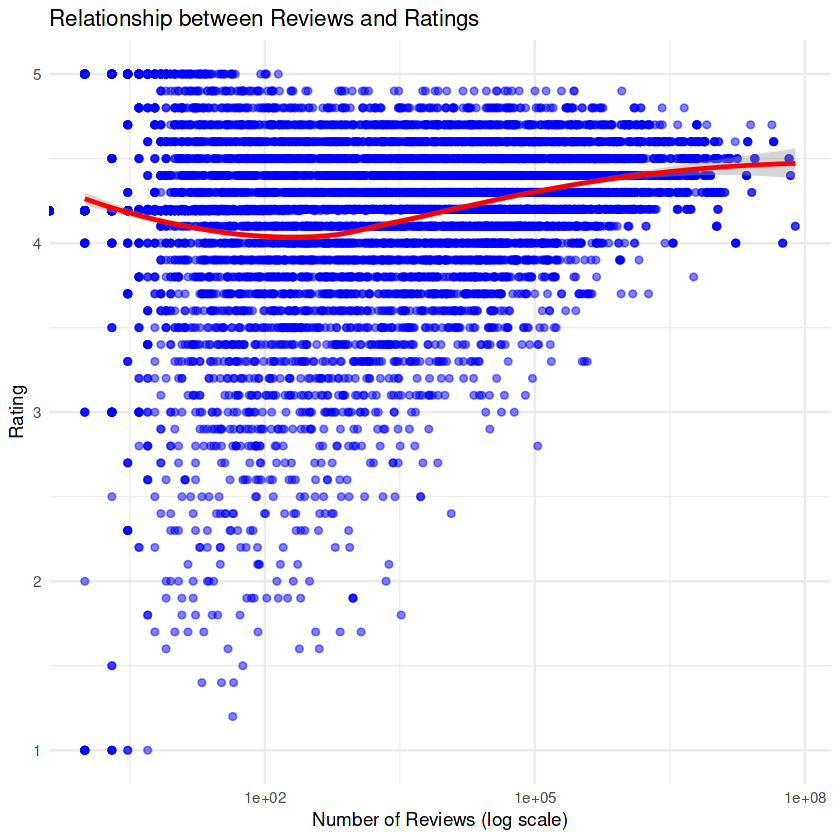
7. Reviews vs. Ratings

Apps with more reviews tend to stabilize their ratings, indicating a direct correlation between user engagement and app credibility.
8. Impact of App Size

Larger apps, especially in the "Games" category, often garner higher ratings, likely due to better graphics and richer features.
9. Variable Correlations
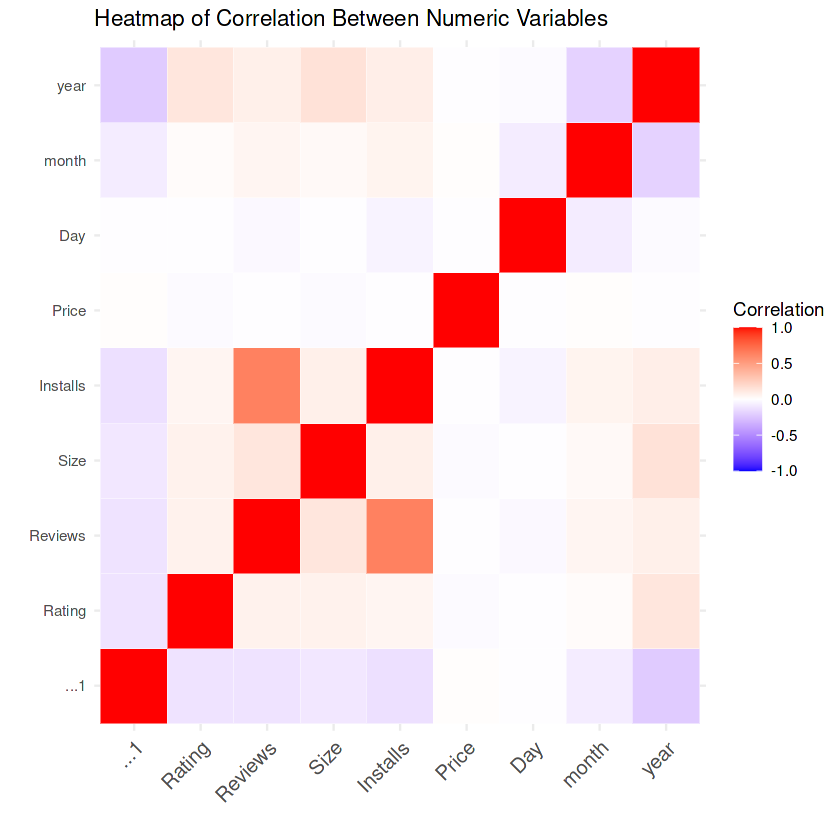
The number of installs strongly correlates with reviews, emphasizing the importance of visibility and active user feedback.
Free vs. Paid Apps
10. Market Share
Free apps dominate the market in terms of volume, while paid apps enjoy a reputation for better quality and user satisfaction.
11. Price Distribution
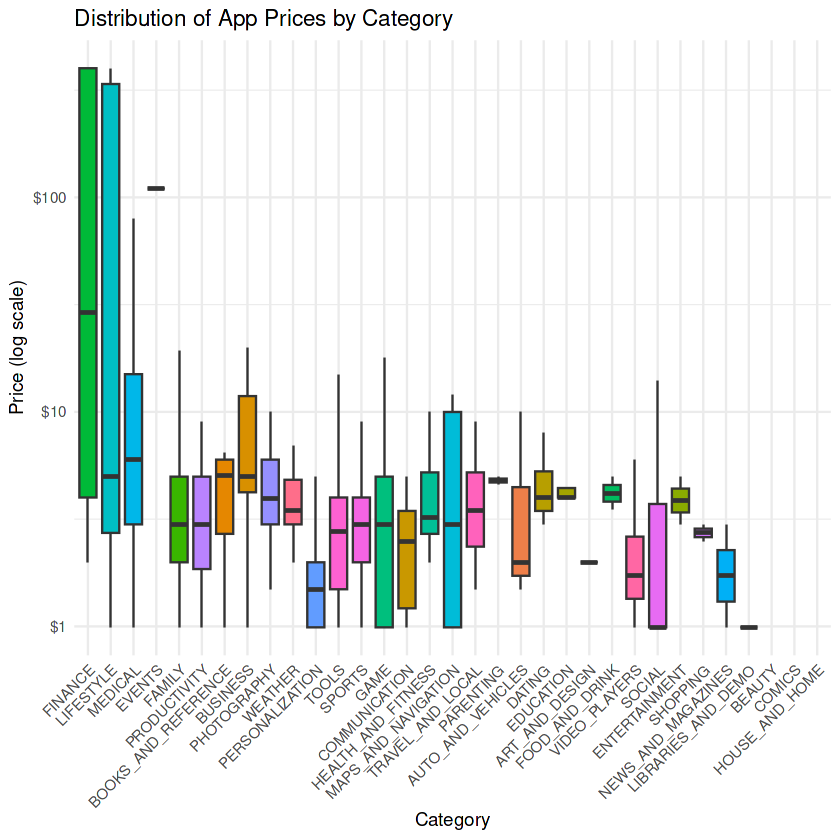
"Medical" and "Books" apps command higher prices, catering to niche audiences and professional needs.
Comprehensive Analysis
12. Average Ratings and App Volume
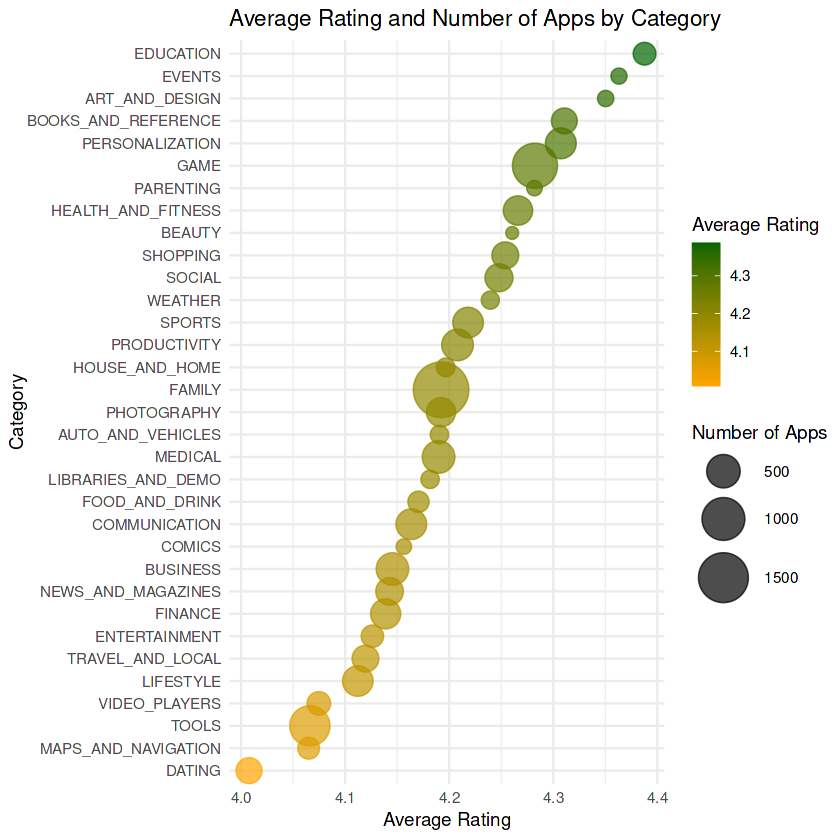
High-volume categories like "Games" often show slightly lower average ratings due to increased competition and diverse quality levels.
13. Ratings Density
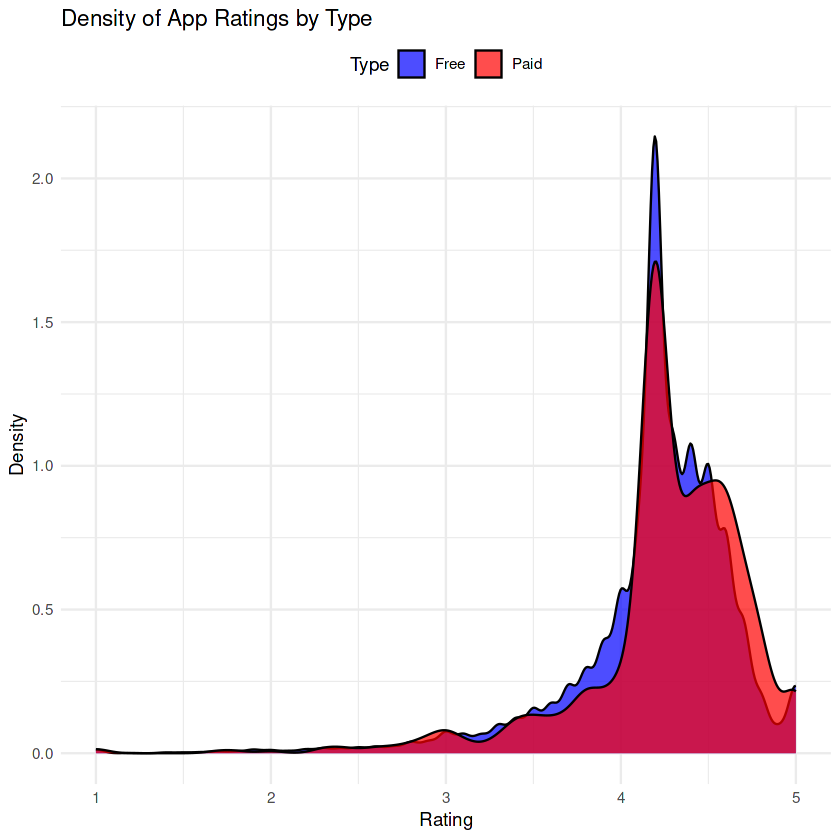
Free apps exhibit a wider range of ratings, while paid apps cluster around higher ratings, reflecting their premium positioning.
14. Pricing and User Engagement
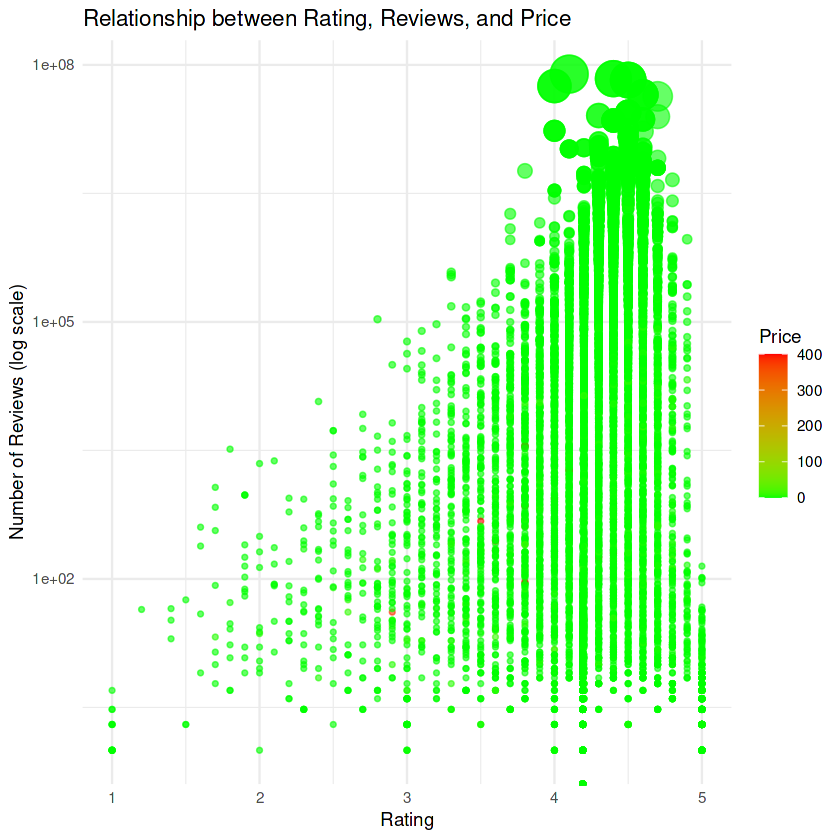
Higher-priced apps often attract loyal users, reflected in strong ratings and review counts. This highlights the value of targeted pricing strategies.
Conclusion
The analysis uncovers significant trends in app performance on the Google Play Store:
- "Games" and "Family" dominate in terms of app count and user engagement.
- Paid apps maintain a competitive edge in quality and user satisfaction.
- User engagement metrics like reviews and installs are critical to app success.
- Strategic growth occurred during 2017, reflecting shifts in the app ecosystem.
Code
Explore the full analysis and code: Google Play Store Analysis Code